This article was last updated on April 16, 2022
Canada: ![]() Oye! Times readers Get FREE $30 to spend on Amazon, Walmart…
Oye! Times readers Get FREE $30 to spend on Amazon, Walmart…
USA: ![]() Oye! Times readers Get FREE $30 to spend on Amazon, Walmart…
Oye! Times readers Get FREE $30 to spend on Amazon, Walmart…
Now that the Obama Administration is officially finished, I thought that it was a good time to revisit a subject that I haven’t posted on for nearly two years, a look at the debt associated with each administration since the beginning of the Kennedy Administration in January 1961. This posting will look at which administration was responsible for the greatest nominal increase in debt as well the percentage growth in debt and the compounded annual growth rate of the debt by administration.
The data used in this posting is sourced from the TreasuryDirect website which provides a daily debt update to the penny. Since the daily data is not complete going back five decades, I have used the debt figures for the end of the month of January for each inauguration year. In the cases of the Kennedy, Johnson and Nixon Administrations where their presidency ended or started abruptly in mid-month in mid-term, I have used the debt data from the end of their last/first month of service. As well, it is important to note that I have used the total debt which includes both external market debt and intergovernmental debt in my calculations.
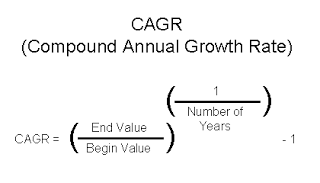
It is also important to look at the formula used to calculate the compound annual growth rate or CAGR of the debt during each presidency since this measure shows us the compounded average annual growth rate of the debt over the entire term of each president, reducing the effect of inflation on the debt. Here is the formula used to calculate the compound annual growth rate:
Let’s start with a table showing the data and calculations that are used for the graphs in this posting, noting that I have used the debt accrued up to the last full day of Barack Obama’s presidency:
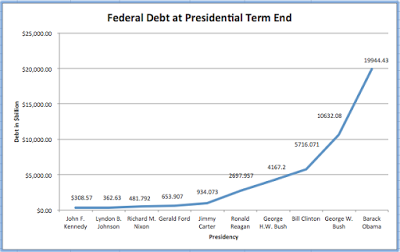
Now, let’s look at a line graph showing what has happened to the debt over each administration:
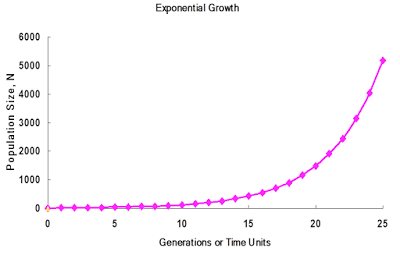
As you can see, the growth in the federal debt nearly doubled from the Clinton to Bush II Administrations (growth of 86 percent) and again from the Bush II to Obama Administrations (growth of 87.6 percent). Over that eight year period from 2008 to 2016, the cumulative rate of inflation was 11.5 percent meaning that only a tiny fraction of the growth in the debt can be attributed to a drop in the real value of money. As well, perhaps it’s just me but as the decades have passed, the growth in the debt looks to be increasingly resembling an exponential function where the value starts to parallel the “y” axis like this example which shows population growth versus time:
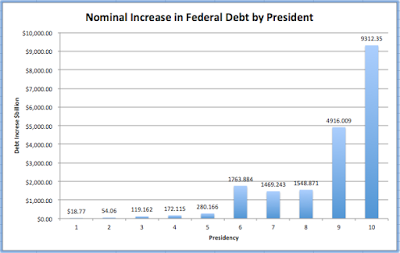
Here is a graph showing the nominal increase in the federal debt for each presidency:
Clearly, the Obama Administration is the “winner” in this category.
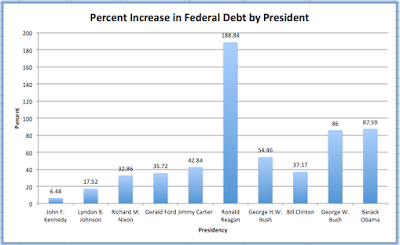
Here is a graph showing the percent increase in the federal debt for each presidency:
Obviously, two-term presidents are going to look worse; that said, we can easily see that the Reagan Administration was responsible for the largest percent increase in debt over its two terms, more than double the growth rate see by either the Bush II or Obama Administrations.
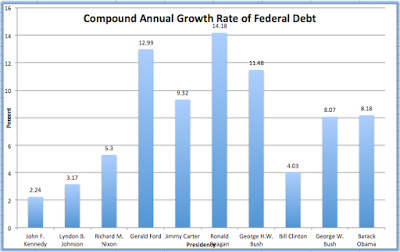
Here is a graph showing the compound annual growth rate of the federal debt for each presidency:
Once again, the Reagan Administration wins this category, followed by the Ford and Bush I Administrations. Interestingly, although the debt grew by the most in nominal terms during the Obama Administration, it comes in at the midpoint of all administrations when it comes to the compound annual growth rate of the federal debt.
While the Obama Administration is responsible for nearly half of the $20 trillion debt, the situation would be far worse if the Federal Reserve had not stubbornly maintained its near-zero interest rate policies. Given that the debt has nearly doubled since 2008, interest owing on the debt on an annual basis has barely budged; hitting $432.65 million in fiscal 2016 compared to $451.15 million in fiscal 2008. For example, in December 2016, the average interest rate on marketable debt was 1.986 percent and on non-marketable debt was 2.798 percent. This compares to 3.207 percent and 4.634 percent respectively in December 2008. This tells us that the Federal Reserve is currently the best friend of the U.S. Treasury.
It is an interesting exercise to look at a history of the American federal debt and see how each administration has led us closer to the debt crisis point. Should interest rates rise even to the levels seen in 2008 when the Great Recession was barely entrenched, the fiscal situation in Washington could reach the critical point and American taxpayers could find themselves spending more on debt interest payments than they currently are on entitlement programs In any case, it looks like the Trump Administration may well have inherited a ticking debt time bomb.
Let’s close this posting with a look back at a much younger presidential candidate, Barack Obama, from July 2008:
By his own logic, does this make Barack Obama an even less responsible and less patriotic American than his predecessor?
Click HERE to read more.
You can publish this article on your website as long as you provide a link back to this page.


Be the first to comment