This article was last updated on April 16, 2022
Canada: ![]() Oye! Times readers Get FREE $30 to spend on Amazon, Walmart…
Oye! Times readers Get FREE $30 to spend on Amazon, Walmart…
USA: ![]() Oye! Times readers Get FREE $30 to spend on Amazon, Walmart…I recently posted an article on the dropping velocity of money, a rather odd occurrence given that the Federal Reserve has been pumping and dumping as much "cash" as the system can handle in an effort to stimulate economic growth. Various measures of the money supply have increased dramatically over the past five years since the Fed began QE 1 in November 2008 especially when one looks back at their growth rate back to the mid-1970s.
Oye! Times readers Get FREE $30 to spend on Amazon, Walmart…I recently posted an article on the dropping velocity of money, a rather odd occurrence given that the Federal Reserve has been pumping and dumping as much "cash" as the system can handle in an effort to stimulate economic growth. Various measures of the money supply have increased dramatically over the past five years since the Fed began QE 1 in November 2008 especially when one looks back at their growth rate back to the mid-1970s.
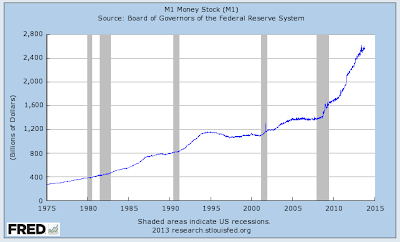
Here's what has happened to M1:
Here is the percentage change of M1 on a year-over-year basis:
As you can see, on average, M1 has grown at a far higher rate since the end of the Great Recession than it has since the mid-1970s and it has done so for a far longer period of time. At its post-Great Recession peak in October 2012, M1 was growing at a rather frightening 22.5 percent on an annual basis, a record level of growth when looking back to the mid-1970s.
Here's what has happened to M2:
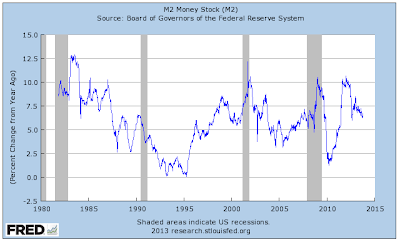
Here is the percentage change of M2 on a year-over-year basis:
While the growth in M2 was not as dramatic as the growth in M1, it still grew at an elevated rate of around 10 percent for a nine month period between August 2011 and June 2012 and has since dropped back to the still rather high level of 6.7 percent on a a year-over-year basis.
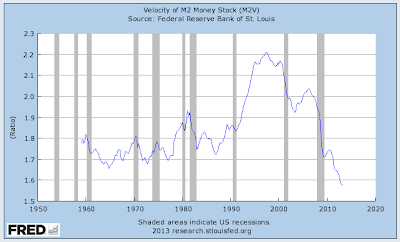
Now, why should we be concerned about all of this? Right now, the velocity of money is very low meaning that all the money that the Fed is "printing" is not being spent as many times as it normally would as shown on this graph:
In fact, M2 is being spent at historically low levels looking all the way back to the late 1950s.
Now that we have that behind us, the problem will occur when consumers decide that they want to spend all of that wonderful money that Mr. Bernanke and his merry band of bankers have printed, toiling long hours over their overheated printing presses (kind of conjures up a Dickensian novel, doesn't it?). When (if) consumers start spending and demand for goods and services rises, all of those dollars will be chasing a finite number of goods and services, pushing inflation (CPI) out of its current rather tame range as shown here:
A recent brief by Dr. Steven Cunningham, Chief Economist at the American Institute for Economic Research suggests that the economy may be showing the initial signs of inflation in the economy. He notes that several key factors in the private sector are creating fuel for inflation as follows:
1.) The rise in overall capacity utilization: As shown on this graph, overall capacity utilization has grown to its post-Great Recession high of 77.8 percent:
The current level of utilization is up markedly from its 45 year low of 66.9 percent experienced in June 2009. Once overall capacity utilization reaches 80 percent or more, inflationary pressures tend to build in the economy.
2.) The rise in the producer price index (PPI): As shown on this graph, the PPI is now very close to its highest level since the end of the Great Recession and is around the the level seen as the recession set in during 2009:
In fact, the PPI has risen from a low of 168.1 in March 2009 to its current level of 204.3, a rather substantial gain. August 2013 saw the PPI for finished goods (mainly energy and consumer foods) rise by an annualized rate of 3.7 percent. Finished energy prices rose by 10.5 percent on an annualized basis and finished consumer food prices rose by 7.3 percent on an annualized basis, led by a 26.9 percent increase in fresh and dry vegetable prices.
The saving grace has been consumer spending. As shown on this graph, consumer spending has been dropping for much of the past year, however, it seems to have stabilized or risen slightly since April 2013:
While consumer confidence has not reached the levels seen during previous recoveries, it is in the neighbourhood of the highest levels it has seen since 2008 as shown here:
As economists point out, it takes both demand and money to create inflation. The money has already been created, thanks to the Fed, with the monetary base up an annually compounded rate of 36.3 percent over the past year alone. Banks are now holding 3500 percent of their reserve requirements rather than the 1 or 2 percent that they normally hold, showing that they are not lending at anything that would approach their normal lending rate. This tells us that there is a huge potential buildup of both lending and money circulation that could take place. When that happens, it could happen very quickly and the pressure could result in severe inflationary pressures in the economy. Everything is in place for the next round of high inflation, the only thing missing is consumer demand. It's just a matter of waiting until consumers have the confidence and desire to consume and decide that they want to borrow and spend at the same time as banks decide that they want to make money lending to consumers. Then all inflation hell could break loose.
Click HERE to read more of Glen Asher's columns
You can publish this article on your website as long as you provide a link back to this page.


Be the first to comment