This article was last updated on April 16, 2022
Canada: ![]() Oye! Times readers Get FREE $30 to spend on Amazon, Walmart…
Oye! Times readers Get FREE $30 to spend on Amazon, Walmart…
USA: ![]() Oye! Times readers Get FREE $30 to spend on Amazon, Walmart…A recent study, "Wage Woes" by Russ Koesterich at BlackRock examines what is missing in the post-Great Recession recovery and how this missing factor is going to impact growth rates in the economy.
Oye! Times readers Get FREE $30 to spend on Amazon, Walmart…A recent study, "Wage Woes" by Russ Koesterich at BlackRock examines what is missing in the post-Great Recession recovery and how this missing factor is going to impact growth rates in the economy.
Let's open with a look at two key aspects of the economy; real disposable personal income and real personal consumption expenditures. Here is a graph showing how real (after inflation) per capita disposable personal income has changed since the Great Depression:
Notice how the curve flattens after 2007 – 2008? Let's look at that in a bit more detail.
Here is a graph showing the year-over-year annual percentage change in real per capita disposable personal income:
Over the 85 year period, real personal disposable income grew at an average annual rate of 2.06 percent even when all recessions are included. This growth rate dropped substantially after 1998 as shown by the red arrow; between 2008 and 2013, growth dropped to an average of 0.4 percent per year over the six year period, hitting a peak of 1.6 percent in 2011 and a low of -1.3 percent in 2008. Even in 2013, four years after the "recovery", real per capita disposable personal income did not grow at all.
Here is a graph showing real personal consumption expenditures:
After a spending slowdown during the Great Recession, America's consumers are now spending with total real personal consumption expenditures of $10.831 trillion in the fourth quarter of 2013.
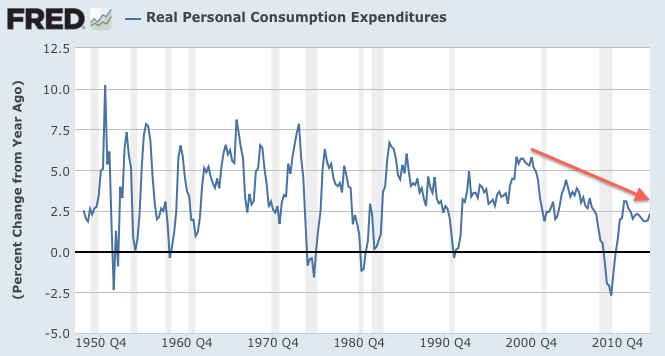
Here is a graph showing the year-over-year growth rate of real personal consumption expenditures:
Note how the red arrow on this graph tracks the red arrow on the second graph? The Great Recession saw the greatest contraction in personal consumption expenditures all the way back to the 1940s and since the end of the recession in mid-2009, annual growth in personal expenditures has risen at an average of 2.2 percent compared to the annual average of 3.3 percent back to the late 1940s when all recessions are included. The graph also shows us that the latest "recovery" has been the most modest when comparing the growth rate of real consumer spending between recessions back to 1948.
Now, let's go to the study. The author notes that real median family incomes have been on the decline since long-before the Great Recession; in fact, the vast majority of American households have had stagnant real incomes since around the year 1998 as shown on this graph:
Obviously, when real household income drops, real disposable income drops. Between 1973 and 2011, a median male working full-time experienced a 5 percent contraction in inflation-corrected income, dropping from $50,000 to $48,200. This means that after adjusting for inflation, an average American male worker has not had a raise in the past 4 decades.
What will change this situation? The author notes that the number of jobless claims is directly related to growth in real income. Historically, when initial jobless claims around around 320,000, real income growth of between 3 percent and 3.5 percent is likely. However, even though the economy is in that level now, there are other factors at play. One key factor, thanks to Washington, is the continuing high level of political and policy uncertainty as measured by the Economic Policy Uncertainty Index (EPUI) as shown on this graph:
Higher levels of political and policy uncertainty leads to lower consumer and business confidence which leads to lower capital spending and lower levels of hiring. The lack of hiring results in much lower upward pressure on wages. The author estimates that the current high level of political and policy uncertainty alone has subtracted half a percent from annual real wage growth. Thanks for nothing Washington!
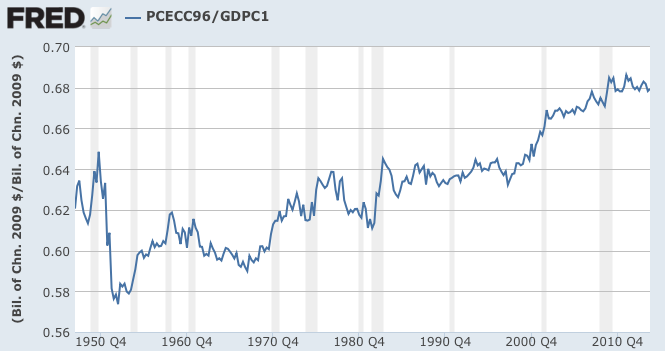
In closing, here is a graph that shows how much of an impact consumer uncertainty has had on the percentage of consumer spending in GDP:
Between 1970 and 2010, the personal consumption component of GDP grew from 60 percent to 68 percent. Since 2010, there has basically been no change; the very modest growth level in consumer spending simply is not contributing more to GDP which results in lower GDP growth which leads to more uncertainty which leads to less capital spending by businesses which leads to less hiring etcetera ad infinitum.
America's economy is caught in a loop from which there appears to be no easy means of extrication. The Fed's pumping and dumping has done relatively little to prod either consumers or businesses to spend, invest and hire, resulting in a situation where there is absolutely no motive for businesses to speed up the pace of wage growth. Without real wage growth, consumers will not spend, businesses will not invest and the economy will not grow. It's as simple as that.
Click HERE to read more of Glen Asher's columns
You can publish this article on your website as long as you provide a link back to this page.


Be the first to comment