This article was last updated on April 16, 2022
Canada: ![]() Oye! Times readers Get FREE $30 to spend on Amazon, Walmart…
Oye! Times readers Get FREE $30 to spend on Amazon, Walmart…
USA: ![]() Oye! Times readers Get FREE $30 to spend on Amazon, Walmart…The Federal Reserve finally has it all figured out. A brief paper by Yi Wen, Assistant Vice President and Economist at the St. Louis Federal Reserve and his Research Associate, Maria Arias, points out who is to blame for why the Federal Reserve's multi-trillion dollar monetary experiment has been such a colossal failure since 2008. Here's their explanation.
Oye! Times readers Get FREE $30 to spend on Amazon, Walmart…The Federal Reserve finally has it all figured out. A brief paper by Yi Wen, Assistant Vice President and Economist at the St. Louis Federal Reserve and his Research Associate, Maria Arias, points out who is to blame for why the Federal Reserve's multi-trillion dollar monetary experiment has been such a colossal failure since 2008. Here's their explanation.
The authors open by explaining the theory of money and inflation. They note that inflation occurs because, according to the monetarist view, there is too much money available to buy the amount of goods and services that the economy produces. The quantity theory of money relates price levels (P), the quantity of goods and services produced (Q), the total money supply (M) and the speed or velocity at which that money circulated in the system (V) in an equation:
M*V = P*Q
This equation tells us that if the supply of money (M) increases at a faster rate than economic output (Q), the price level (P) must increase if the velocity of money (V) is held constant.
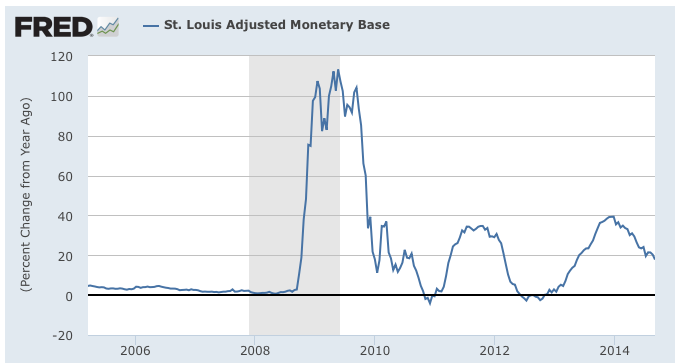
Here's a graph showing the annual rate of growth of the monetary base since 2005:
With output growing at an average rate of just below 2 percent annually between 2008 and 2013 and since the supply of money grew at an average rate of 33 percent per year as shown on the graph above , the rate of inflation should have been about 31 percent per year rather than the 2 percent rate that is the average since 2008. Why did this happen?
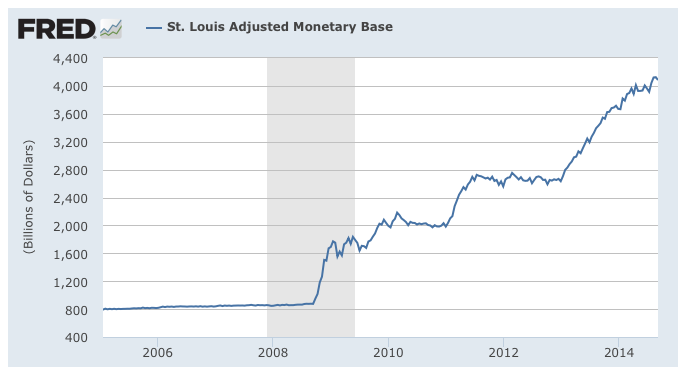
Let's start by looking at the changes in the monetary base, the sum of reserve accounts of financial institutions held at Federal Reserve banks plus all notes and coins. It is basically the money that is easily accessed. Here is a graph showing what has happened to the monetary base since 2005:
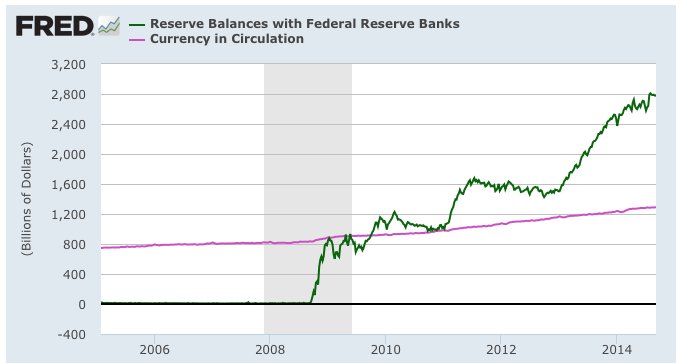
At $4.084 trillion, the monetary base is 4.8 times larger than it was just prior to the Great Recession and is now at its highest level since 1984. Here is a partial breakdown of the monetary base showing the growth in the size of commercial bank reserve balances and the growth in currency since 2005:
As you can see, most of the growth in the monetary base has been from America's commercial banks depositing funds with the Federal Reserve banks.
Now, let's look at the velocity of money, an issue that I have posted on here. The velocity of money refers to the speed at which a given dollar in the economy moves from transaction to transaction. The more often that a dollar is used to buy a service or a consumer item, the higher its velocity and the higher its velocity, the faster the economy grows. When the velocity of money is low, fewer transactions are taking place and the economy is likely to shrink.
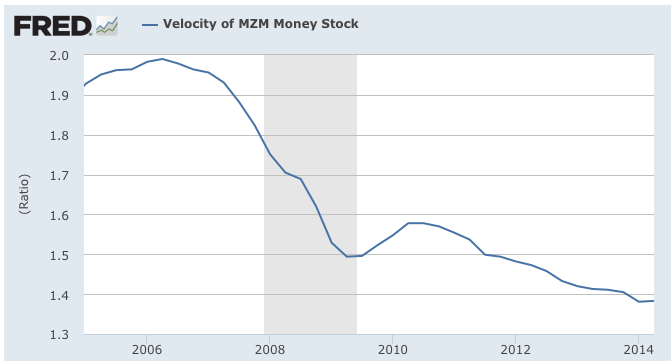
According to Federal Reserve data, this is what has happened to the velocity of the stock of money (MZM) since 2005:
At a ratio of 1.383 in the second quarter of 2014, the velocity of money is at its lowest level since record-keeping began in 1959. This means that a dollar was spent only 1.38 times over the past year, down from 2.0 just prior to the Great Recession.
Now, let's answer the question, "Why did the dramatic increase in the size of the monetary base not lead to massive increases in price (i.e. inflation)?". The authors suggest that:
"The answer lies in the private sector's dramatic increase in their willingness to hoard money instead of spending it.". (my bold)
This has created the dramatic slowdown in the velocity of money as noted above. According to the authors, people have decided to hoard money rather than spend it for two reasons:
1.) A gloomy economy after the financial crisis.
2.) The dramatic decrease in interest rates that has forced investors to readjust their portfolios toward liquid money and away from interest-bearing assets such as government bonds.
While this is an interesting hypothesis, here is what has happened to the personal savings rate since 2005:
At its current level of 5.7 percent, the savings rate is actually lower now that it was for most of the period between 2009 and 2013. In fact, if we go back to the 1960s, the current savings rate is around half of the levels seen through most of the 1960s, 1970s and 1980s.
Here is a graph showing the actual amount of personal savings:
At its current level of $692.5 billion, the amount of personal savings is actually lower now than it was for 2011 and 2012.
It appears that personal savings increased by around $400 billion since the beginning of the Great Recession at the same time as the monetary base increased by over $3 trillion. Obviously, unless Americans are hoarding stacks of cash in their mattresses and not depositing it in any commercial bank, the authors "private sector hoarding theory" is a wee bit suspect.
The authors close by noting that the velocity of money has slowed far more than would normally be expected as interest rates fell because the nominal interest rate on short-term bonds has fallen to the zero-bound meaning that the best form of risk-free liquid assets is no longer short-term government bonds but actual money.
Now you know who is to blame for the ineffectiveness of the Fed's six year long monetary policy – it's all of those American cash hoarders hanging on to every dollar that the Fed so kindly "prints" for them.
Click HERE to read more of Glen Asher's columns
You can publish this article on your website as long as you provide a link back to this page.


Be the first to comment