This article was last updated on April 16, 2022
Canada: ![]() Oye! Times readers Get FREE $30 to spend on Amazon, Walmart…
Oye! Times readers Get FREE $30 to spend on Amazon, Walmart…
USA: ![]() Oye! Times readers Get FREE $30 to spend on Amazon, Walmart…
Oye! Times readers Get FREE $30 to spend on Amazon, Walmart…
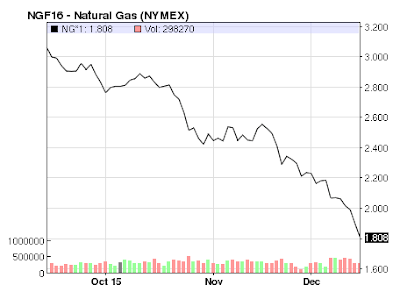
While the markets focus on oil prices, oil producers in North America are suffering from low prices in another of their commodities, natural gas.
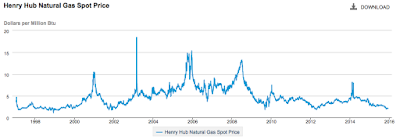
Here is a chart from the U.S. Energy Information Administration showing what has happened to spot natural gas prices at the Henry Hub since 1997:
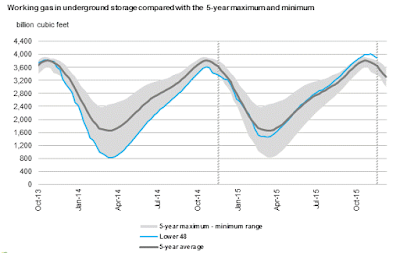
According to the EIA, during the week up to December 9, 2015, natural gas gross production in the United States was down 0.47 percent on a year-over-year basis with Canadian imports down 6.29 percent on a year-over-year basis. LNG imports, on the other hand, were up 45.72 percent on a year-over-year basis. Natural gas in storage dropped by 76 BCF to 3880 BCF as of Friday December 4, however, storage levels are still 15 percent (514 BCF) above the level a year ago and 6 percent (236 BCF) above the five year average of 3644 BCF from 2010 to 2014 for this week. Here is a graphic showing the oversupply situation in 2015 as compared to both 2013 and 2014:
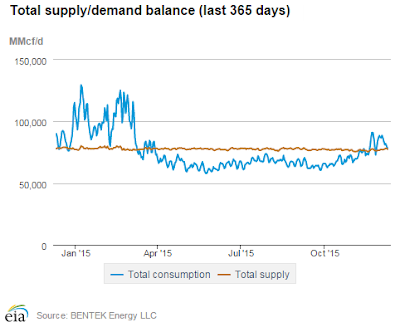
Here is a graphic showing the annual supply-demand balance:
The buildup of supply from March 2015 onward is quite apparent. Consumption was down 3 percent when compared the same week in 2014.
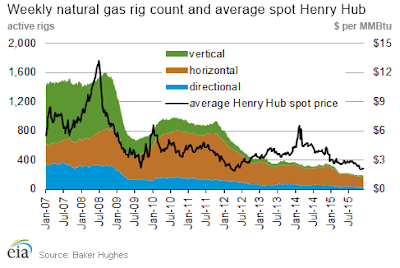
Obviously, such an oversupply situation has had an impact on the weekly natural gas rig count as shown on this graphic:
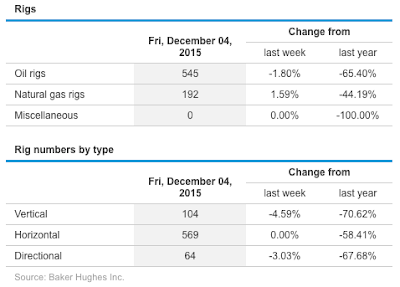
You can see the very close relationship between natural gas prices and the rig count over the past nine years. For the week ending Friday, December 4, the total natural gas and oil rig count fell by 7 units to 737 units, the lowest combined oil rig count since October 1999! Oddly enough, even with the low price of natural gas, the rig count increased by 3 units to 192 units. Here is a table showing the rig count by both product and type:
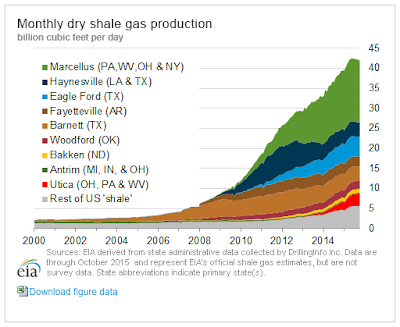
This final graphic shows us exactly why the oil industry has a problem with natural gas prices:
U.S. shale gas production has risen from 2.17 BCF per day at the beginning of 2000 to 42.013 BCF per day in October 2015. Despite low prices over the past year, shale gas production rates have shown very slight declines, falling marginally from a peak of 42.475 BCF in June 2015.
With early December temperatures being 3 degrees warmer than the average for the same week over the last thirty years, unless unseasonably cold weather takes place over the next two months, it is unlikely that natural gas prices will experience upward pressure, adding insult to injury for the nation's beleaguered oil industry.
Click HERE to read more of Glen Asher's columns
You can publish this article on your website as long as you provide a link back to this page.

Be the first to comment