This article was last updated on April 16, 2022
Canada: ![]() Oye! Times readers Get FREE $30 to spend on Amazon, Walmart…
Oye! Times readers Get FREE $30 to spend on Amazon, Walmart…
USA: ![]() Oye! Times readers Get FREE $30 to spend on Amazon, Walmart…
Oye! Times readers Get FREE $30 to spend on Amazon, Walmart…
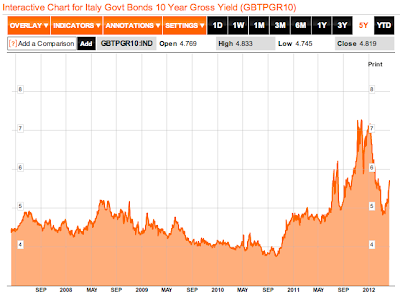
Over the past year, many nations, particularly those in Europe, have seen the yields on their sovereign bonds skyrocket to levels not seen for decades in some cases. Since bond yields rise as bond prices fall, these higher yields are a result of dropping prices for bonds as demand for riskier national debt has decreased. Here is a prime example showing what has happened to the yield for Italy’s debt, noting that it is well above its five year average:
As the third-most indebted nation in the world in nominal terms with nearly €2 trillion in debt, it is no wonder that investors in Italy’s massive sea of bonds are more than a bit nervous.
In the April 2012 edition of the Global Financial Stability Report published by the IMF, economists look at the concept of the sustainability of sovereign debt noting that the recent financial crisis has led to the idea that no asset (i.e. no paper asset) can be viewed as truly safe. This is particularly worrisome for investors as previously riskless assets including U.S. Treasuries have experienced ratings downgrades. The very notion of "risklessness" no longer applies, particularly as public trust in the ratings agencies has declined since the Great Recession. Actually, no investment is viewed as completely without risk, there is always a risk that default could occur in any bond asset, however, for most nations that is very low since national governments have nearly unfettered access to the money that taxpayers have in their wallets.
Here is a graphic showing how the global financial crisis led to greater differentiation in the prices of sovereign debt as investors looked for safety:
You’ll notice that prior to the middle of 2008, the yield on 10 year bonds for all 13 countries in the sample fell within a very narrow band. This changed as the Great Recession set in with Greece being the first nation to break free of the band in late 2008. This was followed by Portugal in late 2009 and by Italy, Spain and Belgium. As yields rose in these five nations, they continued to fall in the remainder of the sample until Austria and France noted a slight rise in yield in late 2011. This was not the intention of the original European Union pact; since all nations had the same currency, all were to be viewed as sharing the same sovereign debt rating. As well, what never ceases to amaze me is how the yield on U.S. Treasuries is at or near historical lows; this for a nation with nearly $16 trillion in debt.
So-called safe assets (government bonds) are very important to the world’s financial marketplace since they are viewed as the most reliable and non-volatile store of value allowing them to be used as collateral since their price has historically been relatively stable. Such is not the case now, largely because the actions of central banks including the Bank of England, the Federal Reserve and the European Central Bank has propped up the prices in some cases by artificially increasing demand for bonds (that is, outside of the normal marketplace demand level), resulting in decades-long lows in yield and record high central bank balance sheets.
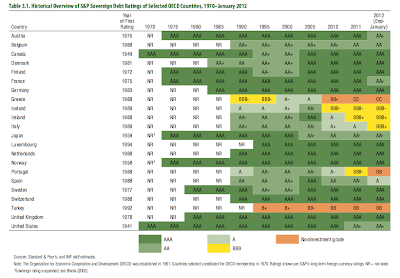
Let’s take a look at the safety level of various OECD nation’s sovereign debt. Here is a chart showing how varied "safety" is across the Eurozone and selected OECD nations as rated by S&P and how those ratings are now the most variable that they have been in decades:
Differentiation in safety as measured by S&P is more pronounced than in previous years with southern Europe and Ireland having historically low ratings and downgrades in countries that previously had AAA ratings including France, Austria and the United States.
Here are two pie charts showing the world’s supply of marketable potentially safe assets ($74.4 trillion worth):
As of the end of 2011, AAA-rated and AA-rated OECD government debt accounted for $33 trillion or 45 percent of the world’s total supply of safe assets. As the European debt crisis has unwound, the supply of sovereign debt that is viewed as a safe asset has fallen, resulting in the removal of $9 trillion of safe assets from the world’s inventory. This represents about 16 percent of the total world’s supply. This will result in distortions within the bond markets since the supply of safe sovereign assets is falling at the same time as the demand is rising, resulting in price distortion to the upside and yield distortion to the downside. According to the IMF, this supply-demand imbalance could have the unintended consequence of forcing investors to settle for assets that have a higher risk profile than what they would normally be comfortable with.
Here is a chart showing the likelihood of default of various ratings interpretations over a five year period:
You can see that, as investors climb down the ratings ladder, the risk of default rises, sometimes to uncomfortable levels. As the flight to so-called safe government bond assets rises and the supply declines, investors will face difficult decisions about where they should invest their hard-earned money to both preserve capital and maximize return, issues that will be increasingly difficult as the world’s level of sovereign debt rises.
Click HERE to read more of Glen Asher’s columns.
Article viewed on Oye! Times at www.oyetimes.com
You can publish this article on your website as long as you provide a link back to this page.


Be the first to comment