This article was last updated on April 16, 2022
Canada: ![]() Oye! Times readers Get FREE $30 to spend on Amazon, Walmart…
Oye! Times readers Get FREE $30 to spend on Amazon, Walmart…
USA: ![]() Oye! Times readers Get FREE $30 to spend on Amazon, Walmart…There is little doubt among economists that the economic recovery since the Great Recession has been somewhat less than robust, excluding the past two quarters. As we can readily see on this chart, economic growth since June 2009 has been modest and rather volatile when compared to other post-recession recoveries:
Oye! Times readers Get FREE $30 to spend on Amazon, Walmart…There is little doubt among economists that the economic recovery since the Great Recession has been somewhat less than robust, excluding the past two quarters. As we can readily see on this chart, economic growth since June 2009 has been modest and rather volatile when compared to other post-recession recoveries:
Gone are the days when we could count on compounded year-over-year economic growth that was steadily in the five percent plus range as it was between 2001 and 2007 and between 1991 and 2000 when it averaged 5.3 and 5.7 percent respectively.
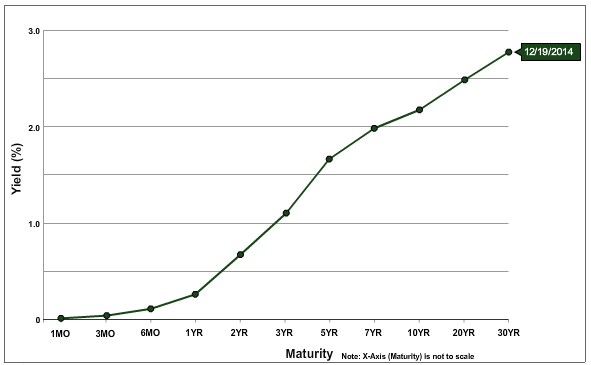
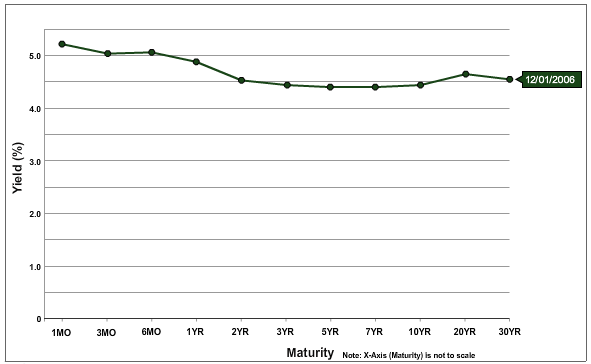
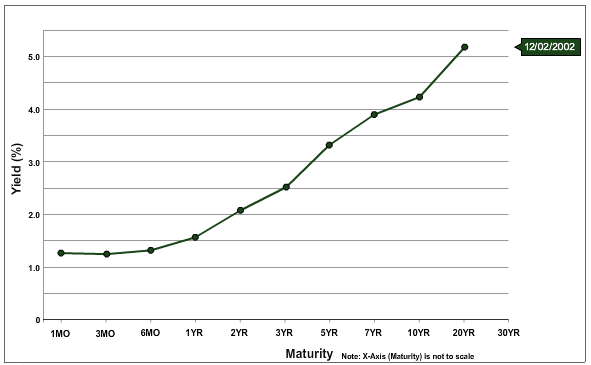
Economists like to use what are termed "leading indicators" when analyzing the economy. Unlike trailing indicators like unemployment numbers, housing starts and inflation data that are reported on after they occur, leading indicators give us a sense of what lies ahead for the economy. One of those leading indicators preferred by many economists is the yield curve. Over the past seven recessions, yields on short-term Treasuries have risen above yields on long-term Treasuries about a year before the economy began to contract. This is known as a yield curve inversion. On top of an inversion, the shape of yield curves can provide an idea of economic growth rates; where the yield curve is steep (i.e. long-term rates are substantially higher than short-term rates), economic growth rates are strong. On the other hand, where the yield curve is shallow or flat (i.e. long-term rates are slightly higher than short-term rates), economic growth rates are modest or weak.
Let's look at three examples. This is what the yield curve looked like in mid-December 2014 (i.e. shallow):
Note that the difference between 1 month and 20 year Treasuries was 2.47 percentage points. Historically speaking, this would be considered a relatively flat yield curve.
This is what the yield curve looked like in early December 2006 (i.e. inverted):
Note that the difference between 1 month and 20 year Treasuries was – 0.67 percentage points. Within a year, the U.S. economy was in a recession.
This is what the yield curve looked like in early December 2002 (i.e. steep):
Note that the difference between 1 month and 20 year Treasuries was 3.91 percentage points, a spread that is far higher than today.
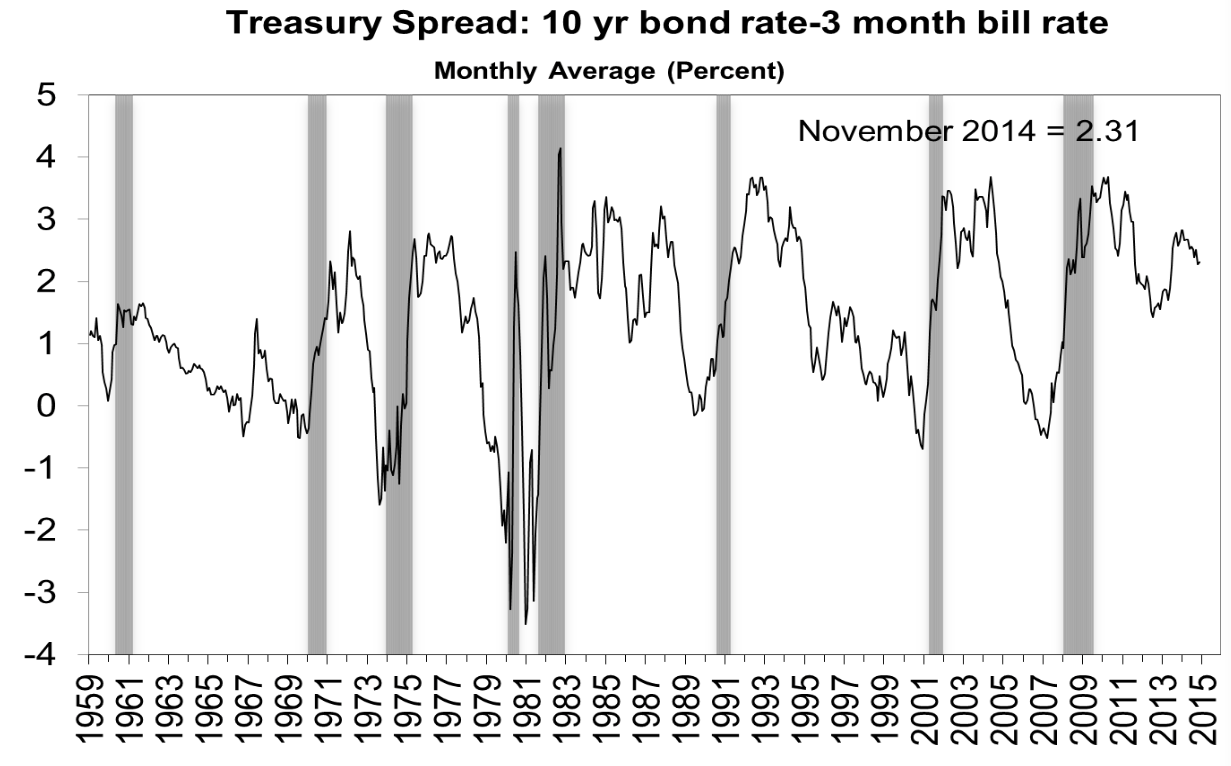
Research by the Federal Reserve Bank of Cleveland looks at the yield curve and provides us with a sense of whether economic growth will return to more normal levels over the coming year or if we're heading for another recession. By using the difference between the current yields on three-month Treasury bills and the ten year Treasury bonds and looking at the history of the spread, the Fed is able to project forward real GDP growth rates and whether or not the economy is heading into a recession.
Let's start by looking at the chances of an economic contraction according to this model. Here is a chart showing the spread between three month and ten year Treasuries going back to 1959:
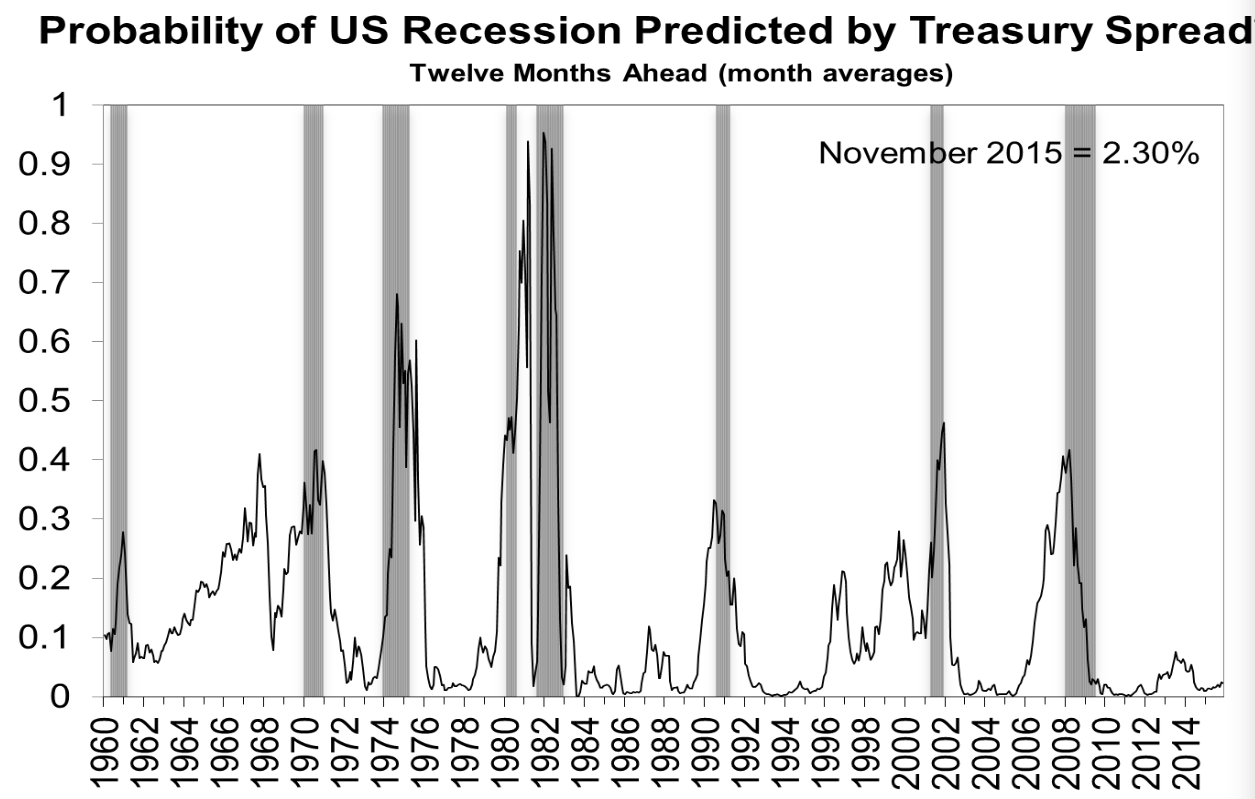
Note that the spread begins to rise quite rapidly as the economy begins to head into a recession, a relationship that has held over the past five decades. This spread is then used to calculate the chance that the economy is about to head into a recession as shown on this chart:
In August 2014, the chance of being in a recession within a year was 2.76 percent, up from 2.46 percent in July and 1.99 percent in June. This is quite low compared to other pre-recession periods, however, as you can see, the Treasury spread can change very rapidly.
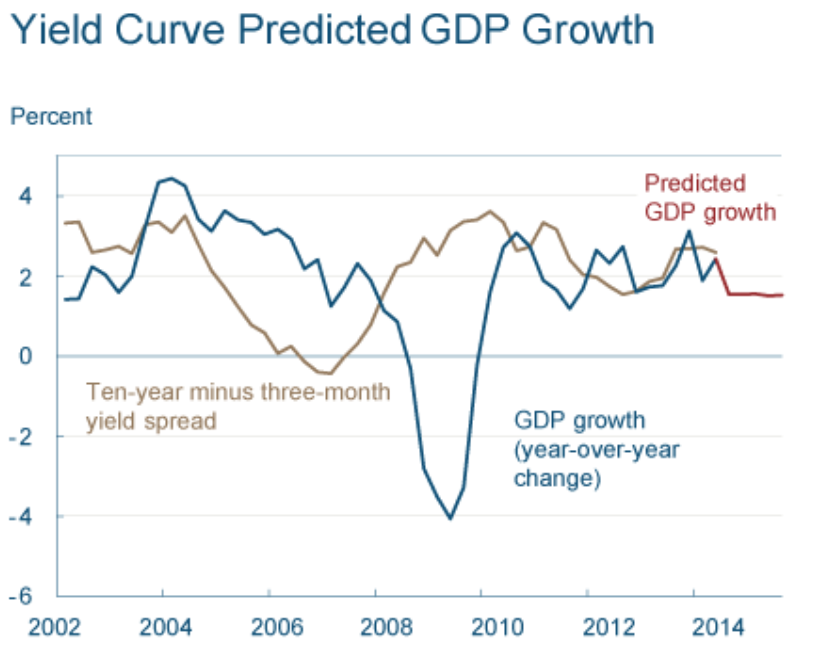
Now, let's look at a chart that shows how GDP growth will look over the next year using the spread in yields:
As you can see on the blue and red line, predicted economic growth is moderate at best with the interest rate spread suggesting that the economy will grow at about 1.5 percent over the next year.
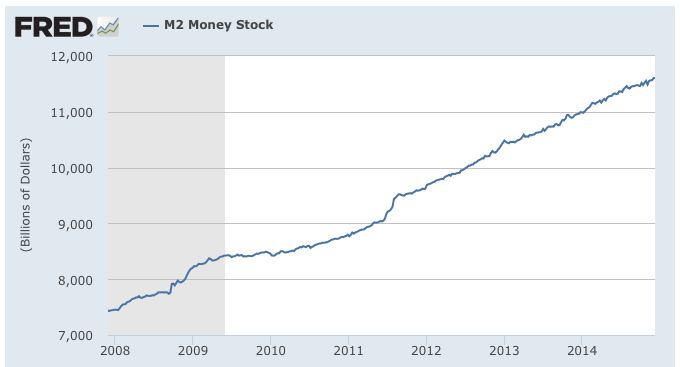
Let's close this brief question and answer. With the Federal Reserve having increased the broader supply of money by 56.2 percent since the beginning of 2008 in a desperate effort to resuscitate the American economy:
…why has economic growth been so modest?
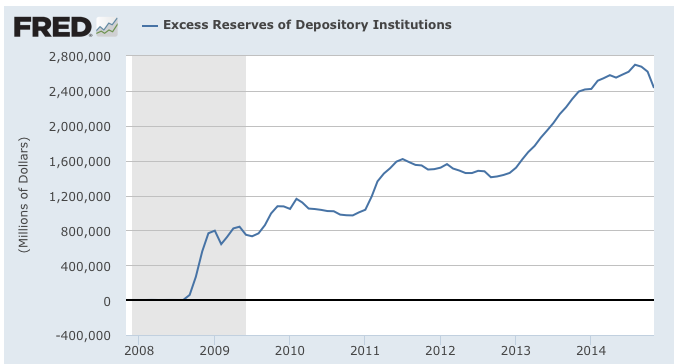
Perhaps this provides us with part of the answer:
Rather than lending out the money "printed" by the Federal Reserve with the intent of commercial bank lending to the private sector, banks are storing the money in the form of excess reserves with the same central bank that "printed" them in the first place. After all, it's far safer to get 0.25 percent interest on all of that cash that banks are sitting on than it is to lend them to American consumers and businesses!
Click HERE to read more of Glen Asher's columns
You can publish this article on your website as long as you provide a link back to this page.


Be the first to comment