This article was last updated on April 16, 2022
Canada: ![]() Oye! Times readers Get FREE $30 to spend on Amazon, Walmart…
Oye! Times readers Get FREE $30 to spend on Amazon, Walmart…
USA: ![]() Oye! Times readers Get FREE $30 to spend on Amazon, Walmart…
Oye! Times readers Get FREE $30 to spend on Amazon, Walmart…
Recent very hot and dry weather throughout much of North America and torrential downpours in the United Kingdom seem to stir up the mainstream media's coverage of global climate change. In this posting, I'll take a brief look at a recent update on the National Snow and Ice Data Center (NSIDC) website. Many scientists feel that the Arctic region will act like the canary in the coal mine for the global climate situation since it is the area that will see the most dramatic climate shift.
NSIDC notes that the extent of sea ice in the Arctic declined quickly in June 2012, setting record daily lows in the middle of the month and ice loss was particularly noticeable in the Kara, Bering and Beaufort Seas as well as Hudson and Baffin Bays. The extent of sea ice is measured using the area of ocean that is covered by at least 15 percent sea ice. On top of these changes to the rate of ice melt, snow extent was unusually low in the months of May and June, part of a repeated pattern of rapid spring snow melt seen in the last six years.
Here is a map showing the extend of Arctic sea ice for June 2012:
The areal extent of sea ice for June averaged 10.97 million square kilometres or 4.24 million square miles. This is 1.18 million square kilometres or 456,000 square miles less than the average over the period from 1979 to 2000 as shown in pink. Based on the data from those two decades, the ice extent noted on June 30th, 2012 would not normally be experienced until July 21st. The last three years have seen June ice extent reaching their lowest values since satellite record-keeping began. The only part of the Arctic region that has seen the extent of sea ice grow is along the east coast of Greenland.
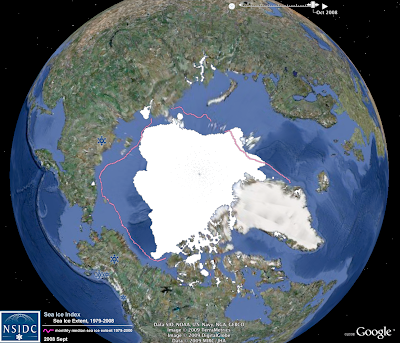
Here is a satellite composite showing the changes in the extent of sea ice in September 2008 compared to the median between 1979 and 2008, once again, in pink:
Here is a graph showing the decline in the areal extent of Arctic sea ice for the month of May since 1979:
On average, sea ice extent has declined an average of 3.7 percent per decade.
Here is a graph showing the extent of sea ice for the months of March through July for the years 2007 to 2012 compared to the median from 1979 to 2000 (in dark grey):
In June 2012, a total area of 2.86 million square kilometres or 1.1 million square miles of ice was lost, the largest June melt on record. Air temperatures at a level of about 3000 feet above the ocean's surface was 1 to 4 degrees Celsius higher than the 1981 to 2010 average and 7 to 9 degrees Celsius higher over northern Eurasia and southern Baffin Bay. These warm temperatures, including a high temperature of 19 degrees Celsius (66 degrees Fahrenheit) on June 17th and 18th, caused the ice to melt 11 centimetres or 4.3 inches in a 24 hour period.
Not only is the extent of sea ice declining, this change is being accompanied by dramatic losses in the area covered by snow. June 2012 set a 45-year record low for snow extent by a significant margin. Snow extent for June 2012 was 1 million square kilometres or 386,000 square miles less than the previous record set in 2010. The concept of albedo states that darker coloured exposed land will absorb more of the sun's energy and will warm faster whereas lighter coloured snow covered land will reflect more of the sun's energy resulting in slower heating and resultant melting. Just think how hot a black asphalt roof becomes on a hot sunny day compared to a lighter coloured surface. Here is a diagram explaining albedo and how it could lead to more rapid Arctic melting, particularly since even meltwater-covered surfaces will absorb more of the sun's energy than snow covered surfaces:
While the weather extremes that we are seeing and the pattern of shrinking Arctic snow and ice cover may be part of long-term climate change, they may also be reflecting temporary changes in shorter term weather patterns, unfortunately, we may not know for many years whether we are truly experiencing a permanent shift in the global climate and by then, it could well be way, way to late to reverse the process. Unfortunately for all of us and what particularly concerns me is that our futures lie in the hands of our elected and terribly ill-informed officials. These non-scientists are using this very sensitive issue to build their voter base and divide and conquer by splitting the world into two climate camps rather than actually implementing policies that could protect our world for future generations.
Click HERE to read more of Glen Asher's columns
You can publish this article on your website as long as you provide a link back to this page.


Be the first to comment