This article was last updated on April 16, 2022
Canada: ![]() Oye! Times readers Get FREE $30 to spend on Amazon, Walmart…
Oye! Times readers Get FREE $30 to spend on Amazon, Walmart…
USA: ![]() Oye! Times readers Get FREE $30 to spend on Amazon, Walmart…
Oye! Times readers Get FREE $30 to spend on Amazon, Walmart…
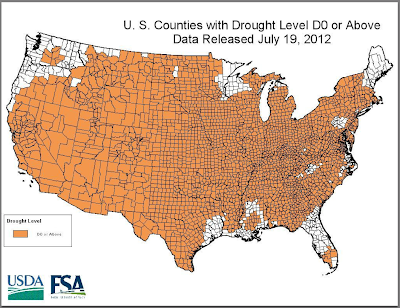
An interesting report that can be found on the Environment America website caught my eye, especially in light of the rather odd weather this past year. "When It Rains, It Pours" by Travis Madsen and Nathan Willcox, takes a look at the increase in extreme precipitation events from 1948 to 2011. I found this research most interesting, especially in light of this map which shows this year's drought conditions throughout the United States:
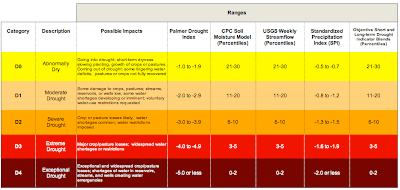
Here's what the D0 drought designation means:
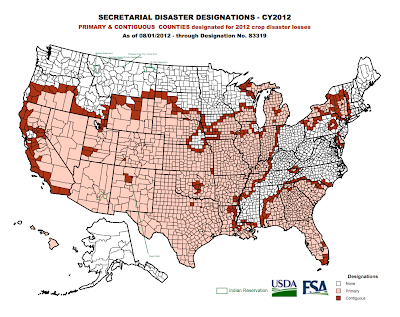
It certainly looks like the federal government is planning for major crop losses across most of the contiguous United States, doesn't it? That's why I found the report from Environment America so interesting.
The authors of the report analyzed more than 80 million daily precipitation records from thousands of weather stations across the United States over the last six decades. With the 24 hour news cycle, consumers of the media are exposed to a litany of "one in a hundred year events" from across the United States and around the globe. Did the authors find that there were actually more high volume precipitation events in recent years than there were two generations ago or is it just an artifact created by the media looking to fill vast periods of empty air time?
The authors' analysis showed that extreme precipitation events, including both snow and rain, have become increasingly frequent since the late 1940s. Basic high school geography taught all of us that warmer temperatures causes more evaporation and transpiration, an important part of the water cycle that ultimately ends with precipitation. As well, we all know that warmer air is capable of holding more moisture. Using satellite data, scientists have found that the water content of the atmosphere is increasing at a rate of about 1.3 percent per decade, a number that is in line with what would accompany the 2 degree Fahrenheit increase in temperature over the past 5 decades.
Fuelled by higher water vapour content, weather systems now contain more moisture that falls to the earth as snow, rain and hail. Scientists have noted that there have been a significant increase in the number of very heavy precipitation events around the world, however, there are some areas that appear to be bearing the brunt of the increase. One of these areas is the mid-latitudes of the United States.
Scientists have made four interesting observations about precipitation in North America:
1.) The average amount of rain falling on days with rainfall has increased for all of North America.
2.) Overall precipitation across North America has risen over the last 50 years (a 7 percent increase in the United States) and extreme downpours have become more common with the amount of precipitation falling in the heaviest one percent of rain events increasing nearly 20 percent.
3.) Extreme downpours were 20 percent more frequent in 2007 than they were in 1950.
4.) The most intense, large downpours have become more frequent toward the end of the 20th century.
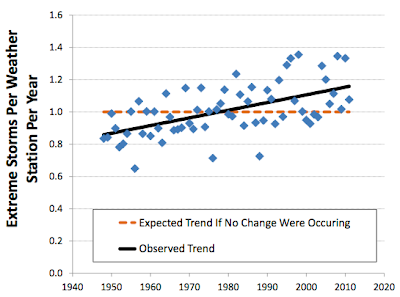
Here is a graph showing the number of extreme precipitation events per weather station per year from 1948 to 2011:
If there were no increase, the dashed orange line would represent the frequency of extreme storms (i.e. there would be no change with time). The data shows that the number of extreme precipitation events has actually increased around 30 percent over the six decades. The top five years with the greatest increase in the number of extreme events have all fallen in the last fifteen years including 2008, 1996, 1998, 2010 and 2004.
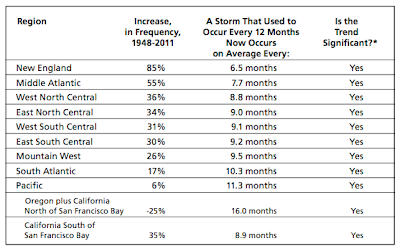
Which parts of the United States have seen the greatest increase in severe precipitation events over the past 60 years? Here is a chart showing the percent increase in storm frequency and how the time between major events has changed:
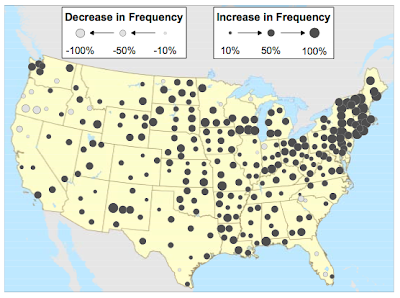
Lastly, let's take a look at a map showing the frequency of extreme storms at various weather stations across the United States:
On average, the biggest storms in 2011 produced about 10 percent more precipitation than the biggest storms 60 years earlier. While that may not seem significant, again, the amount varies greatly across the United States. New England saw a 26 percent increase and the Middle Atlantic region saw a 23 percent increase.
At the state level, New Hampshire and Vermont saw total precipitation from the biggest precipitation events rise by an average of 34 percent over the six decades and Massachusetts, New York, Maine, Pennsylvania, New Jersey, Connecticut and Delaware all saw increases of 20 percent or more. In total, 43 states saw a significant increase in total precipitation from their largest annual storms.
Extreme storms are now responsible for an increasing percentage of total annual precipitation across the nation. In the late 1940s, extreme events were responsible for around 8 percent of total annual precipitation. This has risen to just over 10 percent by 2011 but what is most concerning is that, since 1975, the amount of precipitation from severe weather events has risen at an increasing rate.
If, indeed, there is veracity to the spectre of global warming, given the fact that atmospheric moisture content is so closely tied to air temperature, it is likely that the trend towards increasingly severe precipitation events will continue to grow. This will impact all of us; food prices, insurance rates, the necessity for stronger building codes to withstand flooding, infrastructure replacement rates etcetera will all be related to the occurrence of severe weather.
Click HERE to read more of Glen Asher's columns
You can publish this article on your website as long as you provide a link back to this page.

Be the first to comment