This article was last updated on April 16, 2022
Canada: ![]() Oye! Times readers Get FREE $30 to spend on Amazon, Walmart…
Oye! Times readers Get FREE $30 to spend on Amazon, Walmart…
USA: ![]() Oye! Times readers Get FREE $30 to spend on Amazon, Walmart…
Oye! Times readers Get FREE $30 to spend on Amazon, Walmart…
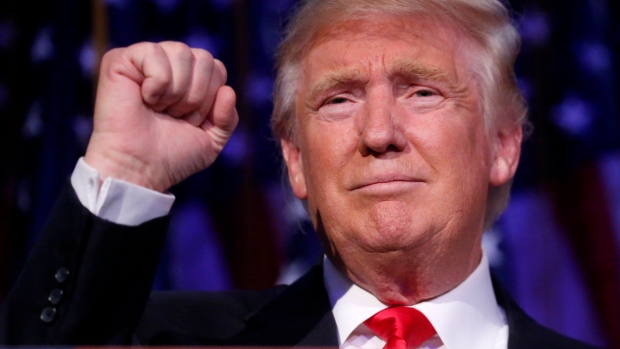
A recent post-election poll by Gallup shows surprising acceptance of Donald Trump as America’s president-in-waiting despite the headline-making “Not My President” protests that erupted across the country.
Gallup asked respondents the following question:
“Now that Donald Trump has been declared the winner and will be inaugurated in January, will you accept him as the legitimate president, or not?”
Nationally, 84 percent of adults answered “yes” and only 15 percent answered “no”. What was surprising was that 76 percent of Clinton voters answered “yes” and only 23 percent answered “no”.
Gallup then asked respondents this question:
“Which comes closer to your view; there has been permanent harm done to the United States as a result of the election process this year (or) there has been no permanent harm done to the United States as a result of the election process this year?”
Nationally, 38 percent of respondents stated that they felt that permanent harm had been done compared to 58 percent who felt that no permanent harm had been done. Respondent’s sentiment varied considerably along party lines as follows:
1.) Trump voters
– 17 percent permanent harm
– 82 percent no permanent harm
2.) Clinton voters
– 60 percent permanent harm
-38 percent no permanent harm
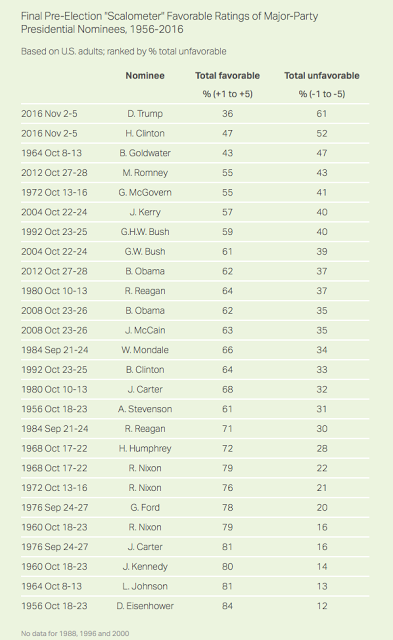
What is interesting to note is that, heading into the election, both Hillary Clinton and Donald Trump were viewed as the most unfavourable candidates in recent history with the exception of Barry Goldwater in 1964 who had a favourable rating of 43 percent. Hillary Clinton’s favourable rating was 47 percent and her unfavourable rating was 52 percent. Donald Trump’s favourable rating was even lower at 36 percent and his unfavourable rating was 61 percent.
For your perusal, here is a table comparing the election eve favourability ratings of Donald Trump and Hillary to those of presidential candidates going back to 1956 in order from least total favourable to most total favourable:
In case you were wondering how the candidate favourability ratings were calculated, respondents are asked their general opinion of each candidate using a 10 point positive to negative scale, using a number between +1 and +5 for candidates that they view as favourable (higher number, more favourable) and a number between -1 and -5 for candidates that they view as unfavourable (lower number, less favourable).
Throughout the later stages of this cycle, It became pretty obvious that many Americans weren’t particularly enamoured with the offerings that both the Democratic and Republican parties had in 2016. With over 40 percent of Americans choosing not to vote, it’s looking like “Democracy: American Style” is incapable of captivating tens of millions of potential voters.
Given the rather emphatic “anti-Trump” nature of news coverage by the mainstream media since November 8th, it’s rather surprising to find that a significant majority of Americans of both political persuasions still see Donald Trump as the legitimate replacement for Barack Obama. I guess you can’t always believe what you read in what passes for mainstream journalism today.
Click HERE to read more.
You can publish this article on your website as long as you provide a link back to this page.


Be the first to comment