
This article was last updated on April 16, 2022
Canada: ![]() Oye! Times readers Get FREE $30 to spend on Amazon, Walmart…
Oye! Times readers Get FREE $30 to spend on Amazon, Walmart…
USA: ![]() Oye! Times readers Get FREE $30 to spend on Amazon, Walmart…
Oye! Times readers Get FREE $30 to spend on Amazon, Walmart…
The Internal Revenue Service has recently released the latest edition of its Individual Income Tax Shares brochure for 2015. This publication provides us with statistics on adjusted gross income (AGI) distribution and income tax by cumulative percentiles of returns, giving us an accurate sense of wealth distribution in America and how it has changed over the past decade. Let’s dive in.
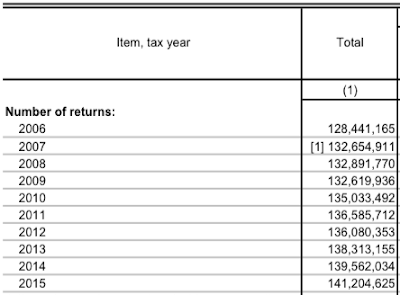
For the 2015 tax year, nondependent taxpayers filed a total of 141,204,625 million individual income tax returns, up 1.2 percent on a year-over-year basis as shown here:
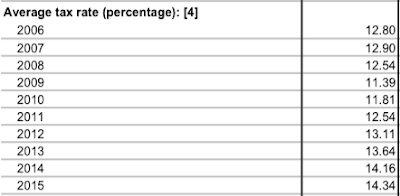
In total, adjusted gross income reached $10.14 trillion in 2015, an increase of 4.5 percent on a year-over-year basis and total individual income tax paid rose by 5.8 percent to $1.45 trillion. The average tax rate for all individual returns filed for the 2015 tax year was 14.34 percent, the highest over the past decade as shown here:
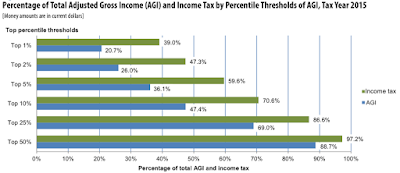
Let’s start by looking at the top half of earners. For the 2015 tax year, the median adjusted gross income was $39,275; these taxpayers accounted for 88.7 percent of total adjusted gross income and paid 97.2 percent of total individual income tax compared to 11.3 percent an 2.8 percent for the bottom 50 percent of returns. Here is a graphic showing the percentage of total income tax revenue and adjusted gross income varies with various percentiles of adjusted growth income thresholds for 2015:
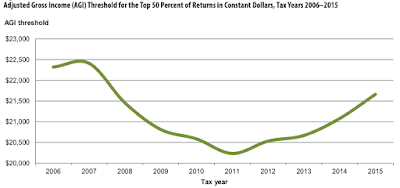
Here is a graphic showing how the adjusted gross income threshold for the top 50 percent of returns has varied over the decade between 2006 and 2015:
As you can see, the Great Recession had a very significant impact on the gross income threshold for the top half of earners, dropping from $22,320 in 2006 to a low of $20,234 in 2011 and back up to $21,663 in 2015 (in constant dollars).
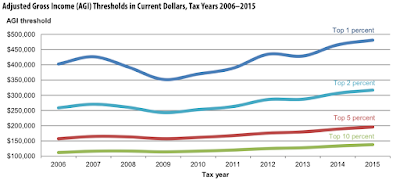
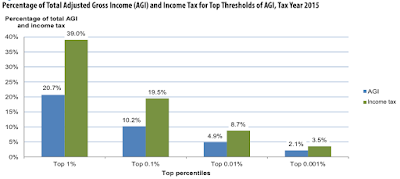
Now, let’s look at the one percent and better. The top 1 percent of tax returns had an adjusted gross income threshold of $480,930 or more and accounted for 20.7 percent of total adjusted gross income and paid 39 percent of total income tax paid by American individuals. Here is a graphic showing how the adjusted gross income threshold for the top 1 percent of tax returns has varied over the past decade along with a comparison of the thresholds for the top 2, 5 and 10 percent for comparison:
The average adjusted gross income for all individuals in the top 1 percent was $1,483,596, up from a low of $983,734 in 2009 but still lower than the decade peak of $1,485,826 reached in 2007 just as the Great Recession was born.
Let’s move to the highest of the highs, the very top of the income heap. Here is a table showing the adjusted growth income threshold history for the top 0.001, 0.01, 0.1, 1, 2, 3 and 4 percentiles (from left to right) of returns:
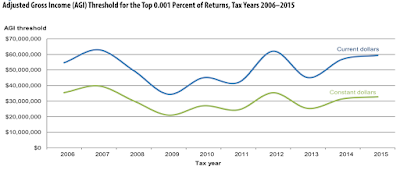
The top 0.001 percent had an adjusted gross income of $59.38 million or more, up 4.2 percent on a year-over-year basis. While this seems very high to pretty much all of us, in fact, it is down from its peak of $62.995 million in the 2007 tax year as shown on this graphic:
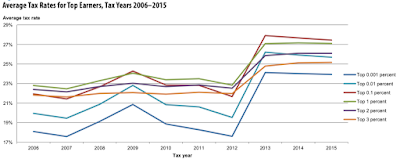
With total adjusted gross income of $214.6 billion, these individuals accounted for 2.12 percent of total adjusted gross income from all Americans and 3.53 percent of total individual income tax, down from 3.62 percent on a year-over-year basis. The average adjusted gross income for these lofty earners was $152.0 million compared to an average of $71,829 for all tax returns. What is particularly interesting about the 0.001 percent, is that their average tax rates are significantly lower than all percentiles from 0.01 percent to 3 percent as shown here:
You will notice that the lower average income tax for the top 0.001 percentile has been lower than their somewhat less wealthy peers for at least the last decade.
Lastly, here is a graphic showing the percentage of total adjusted growth income and total individual income tax paid for the top 1 percent and better:
When looking at tax rates, in 2017, the top 0.001 percent paid an average of 23.93 percent compared to 27.1 percent for the top 1 percent, 23.68 percent for the top 5 percent, 21.37 percent for the top 10 percent and 15.71 percent for the top 50 percent.
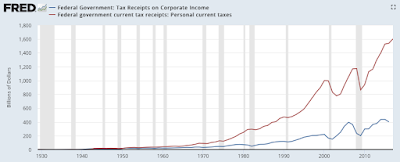
While politicians love to tout the advantages of their “tax plan of the day”, this data clearly shows us that the very highest of American earners have a significant tax advantage, largely because the current tax code favours capital gains over earned income, a situation that Washington is highly unlikely to change any time soon. This graph also shows how the tax system has treated one part of America preferentially over another:
In 1950, Washington’s revenue from corporate taxes equaled its tax revenue from individuals; in 2016, Corporate America paid $401.2 billion in taxes compared to $1540.5 billion for individuals, a nearly fourfold difference. Does that seem like a fair tax system?
 Click HERE to view more.
You can publish this article on your website as long as you provide a link back to this page.


Be the first to comment