This article was last updated on April 16, 2022
Canada: ![]() Oye! Times readers Get FREE $30 to spend on Amazon, Walmart…
Oye! Times readers Get FREE $30 to spend on Amazon, Walmart…
USA: ![]() Oye! Times readers Get FREE $30 to spend on Amazon, Walmart…
Oye! Times readers Get FREE $30 to spend on Amazon, Walmart…
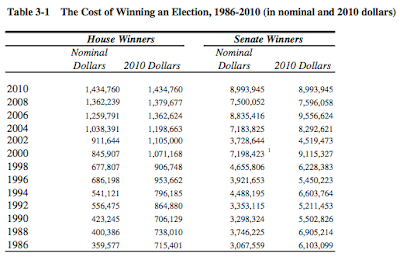
We are all becoming aware of just how expensive it is to gain entrance to America's political theater, most particularly if one has desires to control all of the eggs in the basket. While it looks like the incumbent President could well be on his way to a billion dollar campaign, it is not inexpensive to enter the slightly lower levels of Washington. An interesting table of data published by the Campaign Finance Institute gives us an idea of just how expensive it is to win a seat in the House and Senate as shown on this screen capture:
The average cost of winning a seat in the House rose by 101 percent from $715,401 in the 1986 election to $1,434,760 in 2010 when adjusted for inflation. The cost to win a seat in the Senate rose by 47 percent from $6,103,099 in 1986 to $8,993,945 in 2010, again, in inflation-adjusted dollars. Notice that the cost of winning a Senate seat actually peaked at $9,556,624 in 2006, a rise of 57 percent over 20 years. As well, you'll notice the jump from $6.228 million in 1998 to $9.115 million in 2000; that year's data is skewed by the spending of Jon Corzine of New Jersey who spent $63,209,506 and Hillary Clinton who spent $29,941,194, respectively spending 1334 percent and 632 percent of the average. Apparently, they really wanted to win!
In 2010, all candidates for the House spent, in total, $929,421,775 in their attempts to win the prize; this is up 15 percent from $808,001,712 just two years earlier in non-inflation adjusted dollars. Over the decade, total expenditures rose by 81 percent from $514,793,499 in 2000, again, in non-inflation adjusted dollars. Looking all the way back to 1974, all candidates for the House spent only $44,051,125 resulting in a mean expenditure of only $56,539 for each candidate; a tiny 3.9 percent fraction of what was spent by House candidates in 2010. Corrected for inflation over the 36 year period, $56,539 would increase to only $250,073 showing that the growth rate in expenditures by candidates far, far outstrips inflation.
All candidates for the Senate spent, in total, $568,193,547 for the privilege of potentially taking a seat in the Senate; this is up 46 percent from $389,348,721 two years earlier in non-inflation adjusted dollars. Over the decade, expenditures rose by 48 percent from $384,591,165 in 2000. Looking back to 1974, all candidates for the Senate spent a paltry $28,436,308 resulting in a mean per candidate expenditure of only $555,714 or 6.2 percent of what was spent by Senate candidates in 2010. Once again, correcting for inflation over the 36 year period, $555,714 would increase to only $2,457,935, once again, showing that the growth rate in candidate expenditures is nearly four times the rate of inflation.
Keeping in mind that in 2011, according to the United States Census Bureau, mean household income was $69,677, this data shows that the cost of entry to the upper echelons of the American political scene is limited to a tiny fraction of citizens that have the connections necessary to raise the millions of dollars necessary to run a campaign that has a reasonable chance of success.
Click HERE to read more of Glen Asher's columns
You can publish this article on your website as long as you provide a link back to this page.


Be the first to comment