This article was last updated on April 16, 2022
Canada: ![]() Oye! Times readers Get FREE $30 to spend on Amazon, Walmart…
Oye! Times readers Get FREE $30 to spend on Amazon, Walmart…
USA: ![]() Oye! Times readers Get FREE $30 to spend on Amazon, Walmart…Now that President’s Day is upon us, I thought that it was time to examine the debt incurred by the United States federal government over the past five decades once again, particularly in light of the fact that we have been subjected to a series of debt ceiling negotiations, and in noting that the $17.26 trillion debt has is now sitting at just under 100 percent of GDP as shown on this graph:
Oye! Times readers Get FREE $30 to spend on Amazon, Walmart…Now that President’s Day is upon us, I thought that it was time to examine the debt incurred by the United States federal government over the past five decades once again, particularly in light of the fact that we have been subjected to a series of debt ceiling negotiations, and in noting that the $17.26 trillion debt has is now sitting at just under 100 percent of GDP as shown on this graph:
I looked back over the past 52 years at the debt issues that faced the last 10 administrations. For my source material, I took data from the Treasury Direct website and used their very handy monthly search function to examine the debt history for the years and months in question. To ensure that you understand how I used the numbers, I have taken the debt figures for the end of the month of January or, in the case of Presidents Kennedy, Johnson and Nixon, the end of the month of their last month of service.
Here's the chart showing the Presidents in chronological order with the debt (all debt figures in billions of dollars) at the beginning of each President's term, the debt at the end of the term, the amount in nominal dollars by which the debt grew, the total percentage that debt grew over the President's full term and the length of the President's term (in years and months expressed as a decimal):
It is interesting to see that the current Administration has accumulated more debt that all of the previous Administrations save George W. Bush. You’ll notice that, once again, I have used a somewhat less familiar accounting term, the compound annual growth rate as shown in this formula:
Now, let’s use the compound annual growth rate and put the Presidents in order from least to greatest CAGR:
As it stands now, the Obama Administration has, by a relatively wide margin, the highest nominal debt increase, with the debt rising by $6.627 trillion in five years and one month. This compares to “only” $4.916 trillion for the Bush II administration over an eight-year period. As I’ve noted before, first place overall for the highest percentage and compound annual growth rate for the debt goes to President Reagan who, in his two terms saw the debt rise by a whopping 189 percent or an annual compounded growth rate of 14.18 percent, levels which have not even been approached by more recent Administrations.
Now, let's put all of this into perspective in two ways. With an estimated 316,700,000 Americans of all ages, the per capita debt share for each man, woman and child is:
$54,496
In the last year of President Obama's first term, the median household income in the United States was $51,017 according to the Census Bureau.
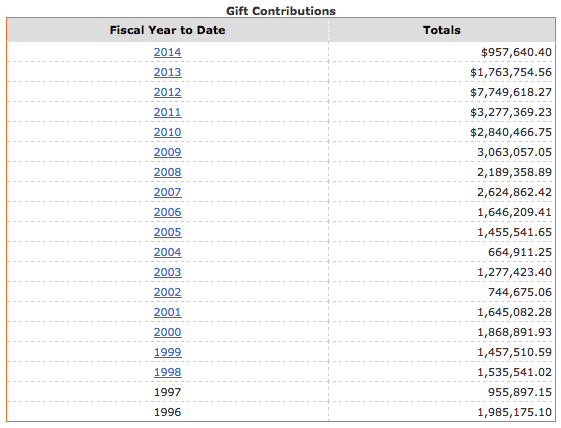
Fortunately for all Americans, the Treasury Department has set up a means by which everyday citizens can make donations that will go directly to pay down the debt. Here is a chart showing how much has been donated on an annual basis since 1996:
Assuming that starting today, there was no additional federal debt accumulated and that on average, taxpayers voluntarily donated $2 million a year to pay down the debt, it would take only 8,629,500 years to pay off what is currently owed by Washington!
Click HERE to read more of Glen Asher's columns
You can publish this article on your website as long as you provide a link back to this page.


Be the first to comment