This article was last updated on April 16, 2022
Canada: ![]() Oye! Times readers Get FREE $30 to spend on Amazon, Walmart…
Oye! Times readers Get FREE $30 to spend on Amazon, Walmart…
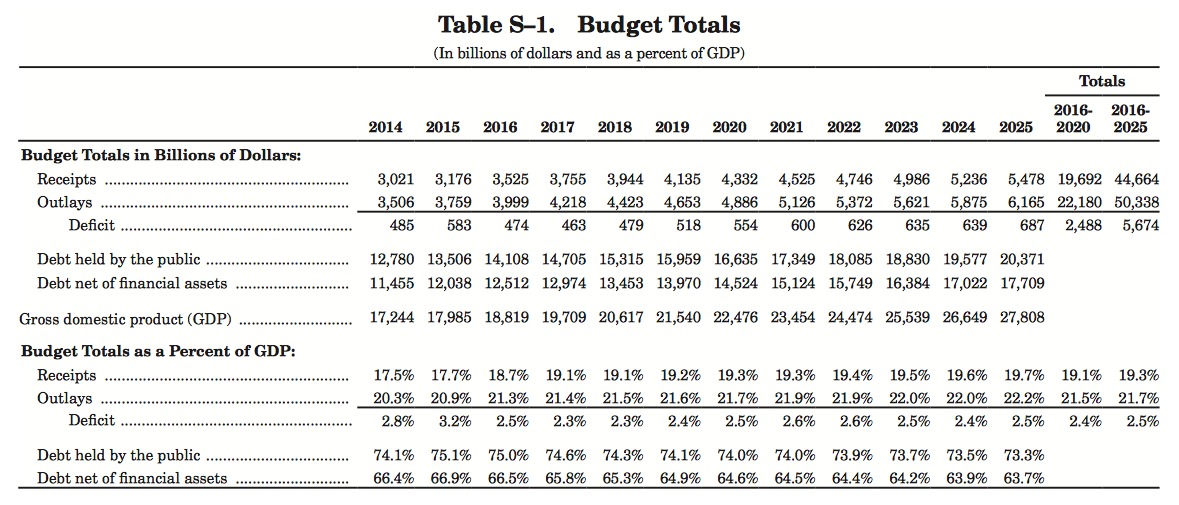
USA: ![]() Oye! Times readers Get FREE $30 to spend on Amazon, Walmart…The White House recently predicted that the budget for Fiscal Year 2016 will produce the smallest budget deficit in eight years, predicting a deficit of $474 billion in 2016 or 2.5 percent of GDP as shown on this table:
Oye! Times readers Get FREE $30 to spend on Amazon, Walmart…The White House recently predicted that the budget for Fiscal Year 2016 will produce the smallest budget deficit in eight years, predicting a deficit of $474 billion in 2016 or 2.5 percent of GDP as shown on this table:
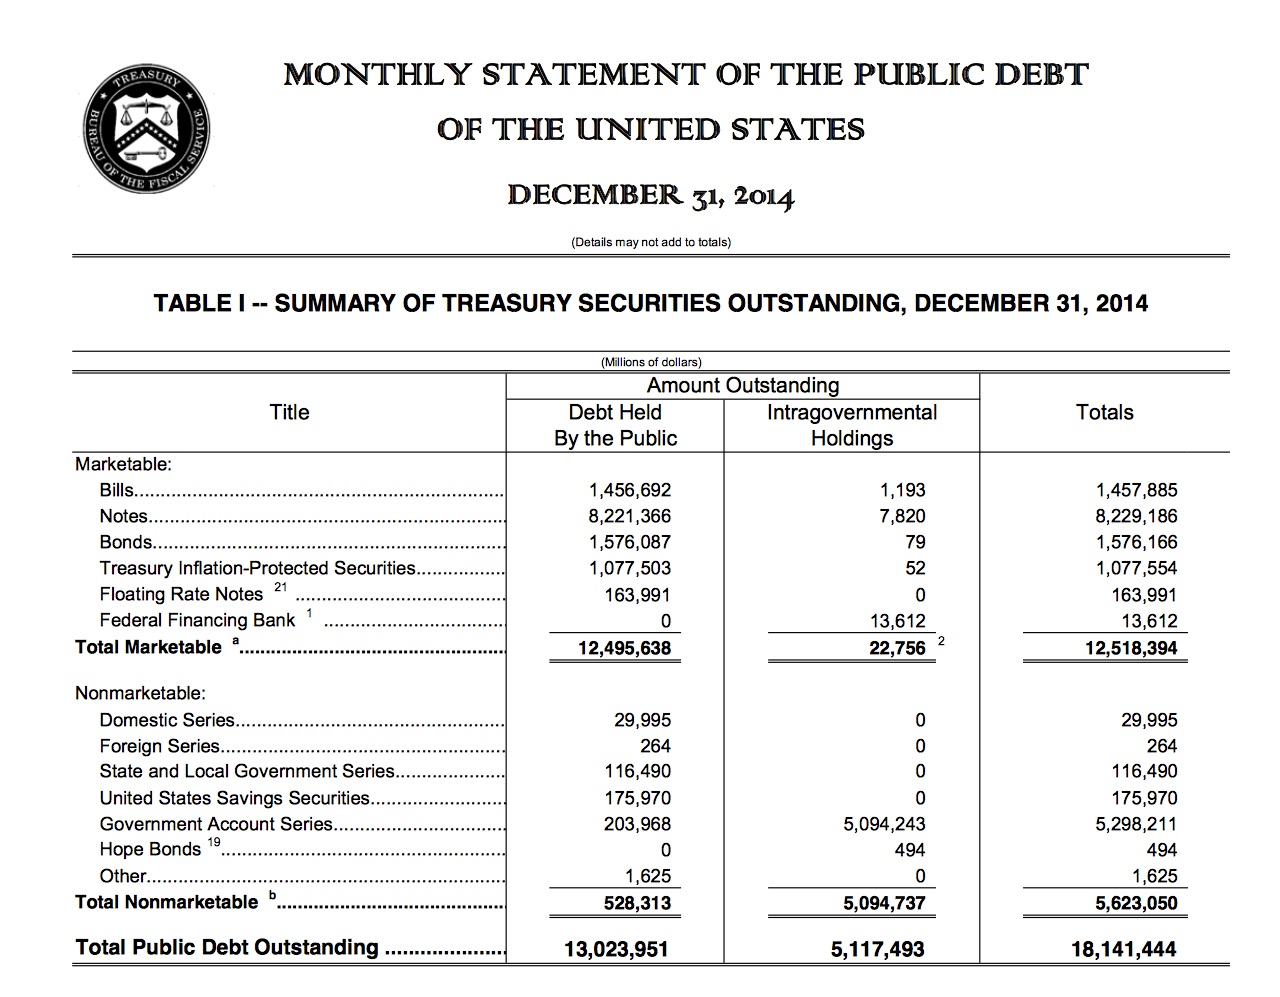
You will notice, however, that the White House predicts that the deficit will gain to rise in 2018, hitting $687 billion in 2025. Between 2016 and 2025, the debt will grow by $5.674 trillion. The debt held by the public (which excludes intragovernmental debt) will rise from $13.506 trillion in 2015 to $20.371 trillion. That said, for a more accurate picture of the debt, we need to look at the Treasury Monthly Statement of the Public Debt for December 2014 which shows the following:
At the end of the year that was 2014, the total public debt outstanding was $18.141 trillion which was made up of two parts; the $13.024 trillion in debt held by the public and the $5.117 trillion in intragovernment debt, that is, debt that is incurred when the government borrows from one part of government and lends it to another (i.e. the Social Security Fund). While the intragovernmental debt doesn't appear on the White House 2016 budget document, the money borrowed from one part of government to fund another part will have to be repaid.
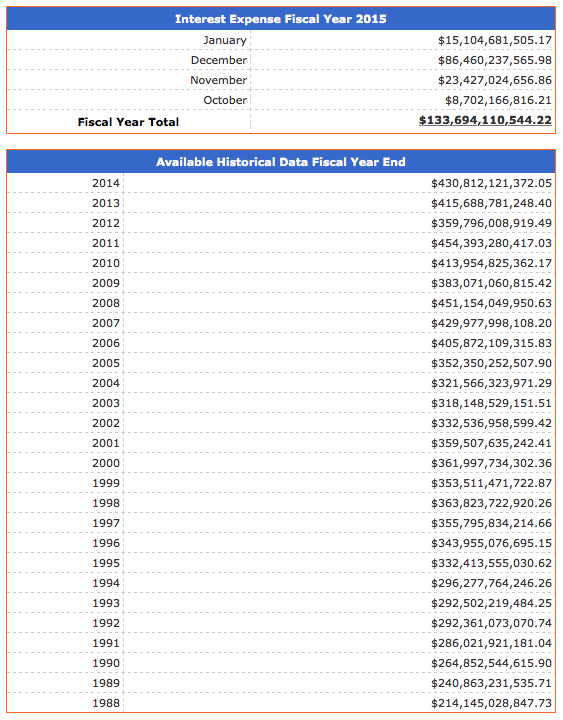
Let's switch gears for a moment and look at the interest expense on the outstanding debt as shown on this screen capture from TreasuryDirect:
For the first four months of fiscal 2015, the government has paid $133.694 million on its outstanding debt. Luckily, the average interest rate on the outstanding debt was only 2.384 percent in January 2014.
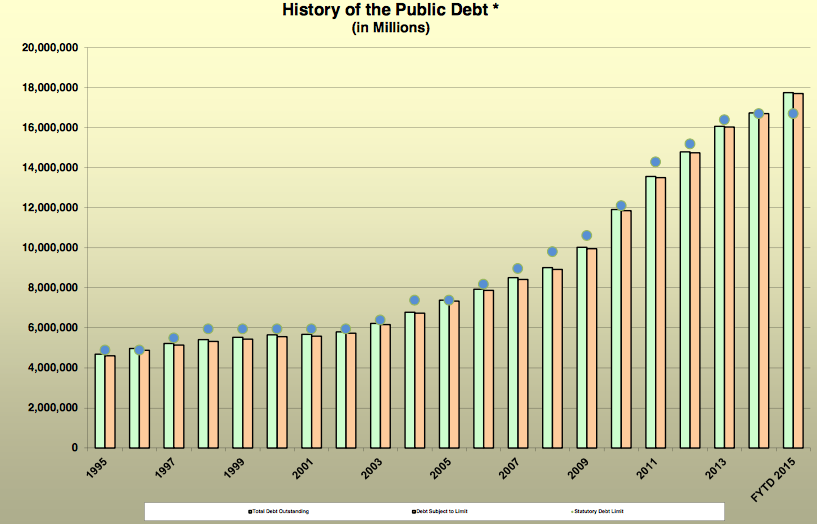
Here is a graph that shows how the debt has grown since 1995:
With that in mind, think about how difficult it will be when interest rates on the outstanding debt begins to rise to historical norms?
Fortunately, the Congressional Budget Office has done a great deal of work on this issue. In its Budget and Economic Outlook: 2015 to 2025, the CBO looks at what will happen to interest payments on the debt over the next decade.
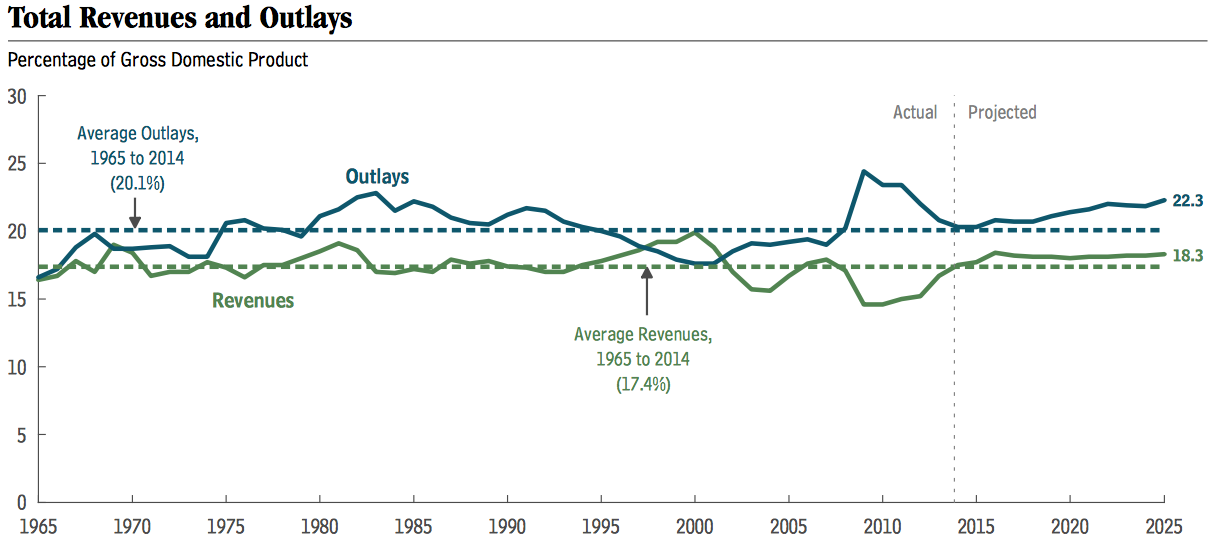
Here is a graph showing how total outlays are expected to be higher than total revenues, a pattern that has been in place since 2000:
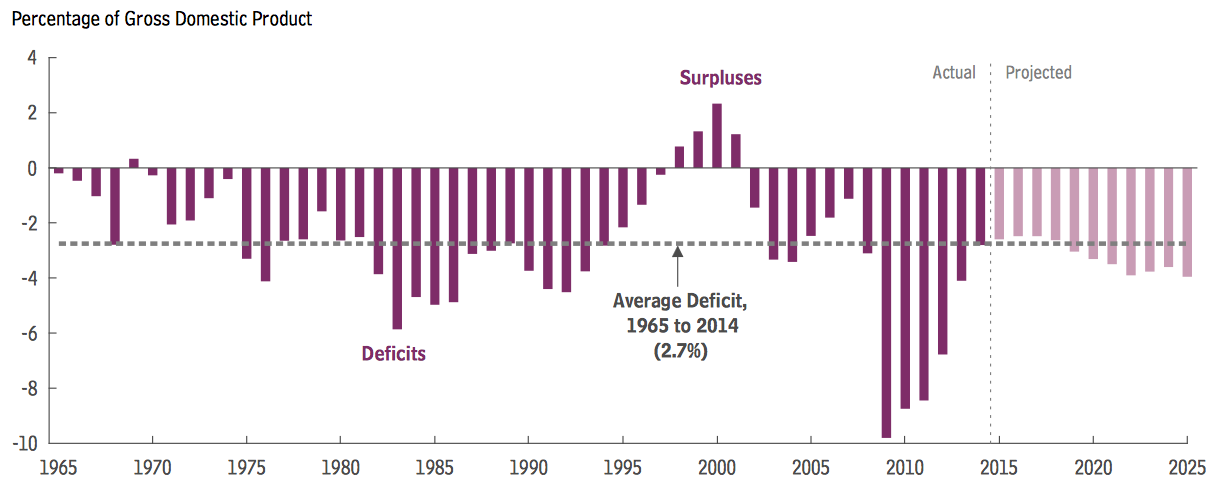
Here is a graph showing the actual and projected deficits/surpluses from 1965 to 2025:
While the deficit is expected to remain steady until 2018, it begins to grow, largely because of rising interest payments on the debt. The projected deficit of $540 billion in 2018 is expected to grow to $1.088 trillion in 2025, a 101.5 percent increase.
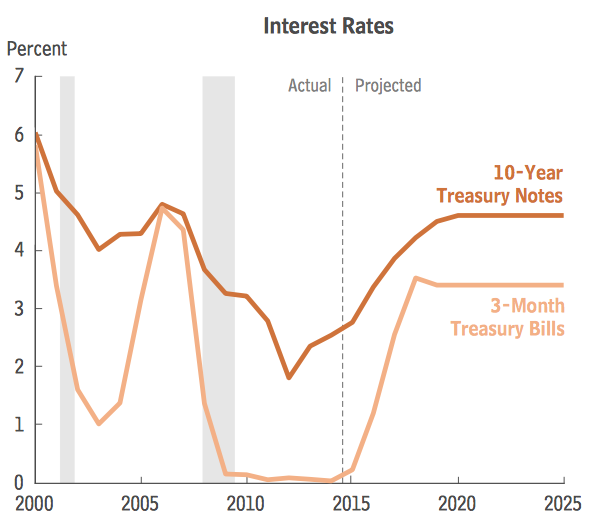
This is a graphic showing the CBO's projections for interest rates from 2015 to 2025:
While these interest rates are just projections, the assumptions used reflect average interest rates for both three-month and ten-year Treasuries prior to the Great Recession.
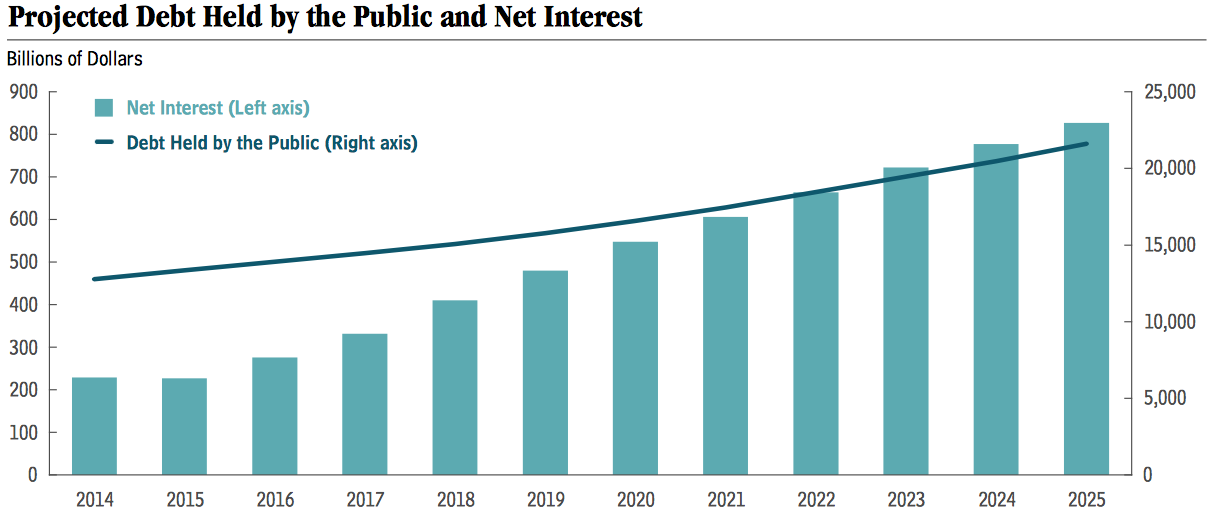
Here is a graphic that shows the CBO's debt and interest owing on the debt projections to 2025:
In 2014, interest paid by the Treasury on all of its debt issuances totalled $431 billion with $158 billion of that being payments to other entities within the federal government (i.e. intergovernmental debt). Under the baseline assumptions used by the CBO, interest payments on the total debt rise from $227 billion or 1.3 percent of GDP in 2015 to $827 billion or 3.0 percent of GDP in 2025, the highest ratio since 1996. This is more than will be spent on Medicare in 2025 ($588 billion) and slightly less than all other mandatory spending on items other than Social Security and Medicare ($910 billion). In the CBO's baseline case, gross interest payments from 2016 to 2025 total $8 trillion with 70 percent of that amount being interest owing on the debt held by the public.
The authors of the report note that there are several problems looming because of the size of the federal debt:
1.) As interest rates rise to historical levels, federal spending on interest payments will rise.
2.) When the federal government borrows money, it increases the overall demand for funds which generally raises the cost of borrowing and reduces lending to businesses. This creates a situation where there is a smaller stock of capital and that pushes output (GDP) growth rates down.
3.) The large amount of debt restricts the actions of policymakers since their ability to use tax and spending policies to respond to economic slowdowns or crises.
4.) Continued debt growth may cause investors to doubt the government's ability and willingness to pay its obligations, resulting in higher interest rates.
As we can see, the combination of rising interest rates and ever-growing federal debt levels will become more and more problematic for Washington. An increasing portion of its revenue stream will be consumed by interest owing on the market debt held by the public. What is even more concerning is that the CBO's projections do not include a period of economic contraction (i.e a recession), an event that will certainly occur over the next decade. This will put additional pressure on the federal government's ability to keep its deficits under control since policymakers will be expected to respond to an economic downturn with stimulus at the same time as revenues are dropping and interest owing on the debt is rising.
You can publish this article on your website as long as you provide a link back to this page.

Be the first to comment