This article was last updated on April 16, 2022
Canada: ![]() Oye! Times readers Get FREE $30 to spend on Amazon, Walmart…
Oye! Times readers Get FREE $30 to spend on Amazon, Walmart…
USA: ![]() Oye! Times readers Get FREE $30 to spend on Amazon, Walmart…
Oye! Times readers Get FREE $30 to spend on Amazon, Walmart…
Recent polling by the Pew Research Center looks at how America has changed, an observation that has become particularly apparent in this election cycle that has seen American voters back candidates that are solidly anti-political establishment. Let's look at how both sides of the political spectrum view life in America today, whether they feel that their lives have become better or worse and link their viewpoints on specific issues to their political leanings and presidential candidate of choice.
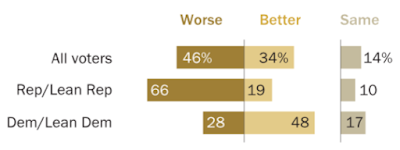
Overall, 46 percent of registered voters of all political stripes state that life in America has become worse than it was 50 years ago with 34 percent stating that life is better and 14 percent stating that life is about the same. A substantial 66 percent of Republican and right-leaning voters believe that life for Americans has become worse compared to only 28 percent of Democrat and left-leaning voters who believe that life has worsened over the past five decades as shown on this graphic:
Let's break it down further. Here's how Republican and right-leaning voters compare life today to life 50 years ago broken down by who they supported as the Republican presidential candidate:
In large part, this explains why there seems to be so much publicly expressed anger among Trump followers; three quarters of them believe that life has become worse compared to only 13 percent who believe that life has improved over the past half century.
Here's how Democrat and left-leaning voters compare life today to life 50 years ago broken down by who they support as the Democrat presidential candidate:
While the divide among voters who lean to the Democratic side of the political system isn't as great as it is in the case of the Republicans, one-third of Bernie Sanders' supporters believe that they are worse off now than they were 50 years ago compared to less that one-quarter of Hillary Clinton's supporters.
If we compare how voters feel about key issues, their feelings vary substantially with who they support:
1.) Immigrants are a burden on America:
Trump – 69 percent yes
Clinton – 17 percent yes
Sanders – 14 percent yes
Overall, 57 percent of registered voters say that immigrants strengthen American society while 35 percent say that they are a burden.
2.) U.S. Muslims should be subject to more scrutiny:
Trump – 64 percent yes
Clinton – 22 percent yes
Sanders – 12 percent yes
3.) Angry with the government:
Trump – 50 percent yes
Clinton – 6 percent yes
Sanders – 13 percent yes
4.) U.S. global involvement makes things worse:
Trump – 38 percent yes
Clinton – 28 percent yes
Sanders – 45 percent yes
Among all voters, 60 percent state that global problems would be worse without U.S. involvement compared to 34 percent who feel that American efforts to solve global problems usually end up making things worse.
5.) Free trade is good for America:
Trump – 27 percent yes
Clinton – 58 percent yes
Sanders – 55 percent yes
6.) The economic system favours powerful interests:
Trump – 61 percent yes
Clinton – 73 percent yes
Sanders – 91 percent yes
7.) It is government's responsibility to ensure that all Americans have health care:
Trump – 14 percent yes
Clinton – 77 percent yes
Sanders – 82 percent yes
It is interesting to see that three-quarters of Hillary Clinton's voting backers believe that the economic system favours powerful interests, particularly in light of the Clinton family's multi-million dollar speech-making industry, many of which have been given to the largest and most powerful corporations in America.
Let's close with how registered voters feel about which candidate would make the best president on a great to terrible spectrum:
Bernie Sanders:
10 percent great
26 percent good
20 percent average
15 percent poor
21 percent terrible
Hillary Clinton:
11 percent great
22 percent good
20 percent average
16 percent poor
30 percent terrible
Donald Trump
10 percent great
16 percent good
12 percent average
15 percent poor
44 percent terrible
Bernie Sanders has the top rating when it comes to average or better at 56 percent compared to Hillary Clinton at 53 percent and Donald Trump at 38 percent. When looked at from the poor or worse side, Donald Trump comes in first (or last depending on your viewpoint) at 59 percent, Hillary Clinton comes in second at 46 percent and Bernie Sanders comes in first at 36 percent.
Voter frustration has rarely been as apparent as it has become during the 2016 election cycle. A substantial percentage of American voters feel let down by their political and economic systems and are becoming increasingly skeptical that the political system will ever improve; one can only hope that this dissatisfaction turns into a voter turnout that exceeds the 60 percent level, a level that was last seen in 1968.
Click HERE to read more of Glen Asher's columns
You can publish this article on your website as long as you provide a link back to this page.


Be the first to comment