
This article was last updated on May 19, 2022
Canada: ![]() Oye! Times readers Get FREE $30 to spend on Amazon, Walmart…
Oye! Times readers Get FREE $30 to spend on Amazon, Walmart…
USA: ![]() Oye! Times readers Get FREE $30 to spend on Amazon, Walmart…
Oye! Times readers Get FREE $30 to spend on Amazon, Walmart…
 Have you ever wondered how much your income would be taxed if you lived in another nation? Fortunately for all of us, the Organization for Economic Co-operation and Development (OECD) recently released its annual Taxing Wages publication which examines the tax and social security burdens on employment incomes throughout the 34 nations that comprise the OECD.
To summarize, the OECD found that the tax burdens on wages and social security charges increased in 22 of the 34 countries in the study over the past year. Overall, the average tax on employment income was 24.8 percent for all 34 countries. The most significant year-over-year drops in taxation were found in Denmark, Greece (rather ironic, don’t you think?), Germany and Hungary. The largest tax increases were experienced by workers living in Spain, Iceland and the Netherlands. The highest taxes on employment income were experienced by single earner, two children couples in Belgium, France and Italy. The same family type had the lowest taxes in New Zealand, Chile and Switzerland.
The report notes that the total tax package on wages, which includes the social security program charges that are shared by both employer and employee, affect the hiring decisions of employers and the willingness of employees to spend their days working. An interesting portion of the study is dedicated to the concept of the “tax wedge”. The tax wedge is basically the difference between “…the total labour costs to the employer and the corresponding net take-home pay for single workers without children at average earning levels in 2010…” defined as a percentage according to the OECD definition. In simplest terms, from the employee’s perspective, the tax wedge is basically the difference between before-tax and after-tax wages. It measures how much the government receives as a result of taxing the work force. The OECD study then compares the 2010 tax wedge to the 2009 level to see how tax levels are changing.
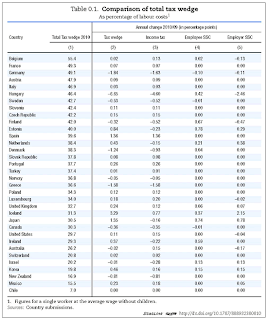
Here is the summary chart showing the tax wedge for each of the OECD nations and the percentage change from the previous year for both income tax and employer and employee social security contributions. Note that the chart is in order from the highest tax wedge to the lowest tax wedge (i.e. from the most taxed workers to the lowest taxed workers):
Let’s look at one example to ensure that we’re all on the same page. In the United States in 2010, the tax wedge was 29.7 percent. From 2009, the tax wedge increased by 0.11 percentage points overall with income tax rising 0.15 percentage points, employee social security contributions staying level (0.00 percentage points) and employer social security contributions dropping by 0.04 percentage points. Remember that these statistics are for a single worker with no children, working at the average wage.
Now let’s look at the overall results. Belgium is by far the highest taxed country with their workers paying 55.4 percent of their total labour costs (total wage package) in taxes. Workers in Chile have the lowest taxes on wages at only 7.0 percent. The tax wedge for workers in the United Kingdom (at 32.7 percent), Japan (at 30.5 percent), Canada (at 30.3 percent), the United States (at 29.7 percent) and Australia (at 26.2 percent) fall in the lower third of all OECD nations.
Some nations saw a rather massive tax wedge drop over the year; the workers in Hungary saw their tax wedge drop by 6.65 percentage points, Germany by 1.84 percentage points and Greece by 1.58 percentage points. Workers in Iceland saw their tax wedge rise by 3.29 percentage points, Spain by 1.36 percentage points and Japan by 1.35 percentage points. Overall, the tax wedge increased in 22 OECD member nations and fell in 11 member nations.
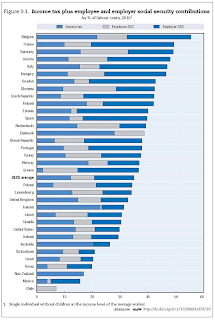
Here’s an interesting graph showing the breakdown in the tax wedge as a percentage of labour costs for each nation. Total labour costs are divided into income tax, employee social security contributions and employer social security contributions. Note the OECD average in the lower middle of the grouping:
This graph gives us an idea of the composition of the tax wedge. In Chile, employee social security contributions are 100 percent of the total labour costs with personal income tax at a wonderful zero percent. Denmark has the highest personal income tax rate of 27.9 percent, followed by Iceland at 22.8 percent and Belgium at 21.6 percent. Canada comes in at 13.3 percent, the United States at 13.9 percent and the United Kingdom at 14.7 percent. The highest employee social security contributions are experienced by workers in Slovenia at 19 percent, followed by Germany at 17.2 percent and by Poland at 15.5 percent.
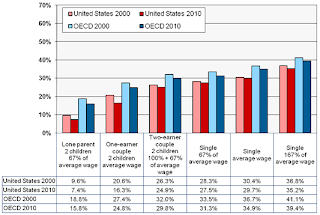
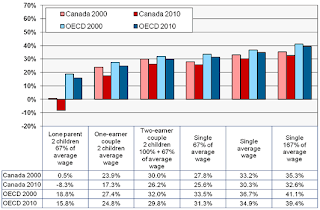
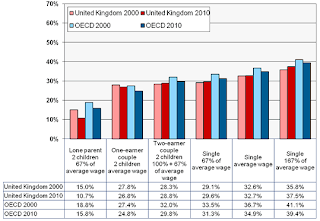
To summarize, I’ll take a brief look at the tax information for three of the nations where most of my readers reside. Note that the graphs show the changes in the level of taxation on employment income from 2000 to 2010 as well as the OECD average:
1.) The United States: The United States levies relatively low taxes on labour income with single tax payers taking home approximately 70 percent of what they cost their employer. For all family types, the tax wedge is well below the OECD average. From 2000 to 2010, the tax wedge decreased for all family types as shown in this graph:
2.) Canada: Canada has a relatively low tax and social security burden on labour income with the average tax wedge being lower than the OECD average for all family types. Interestingly enough, according to the OECD data, a single parent family with low earnings and two children actually has a negative tax wedge since they receive more in government transfers than they pay in taxes. The difference between Canada’s tax wedge and the OECD average has increased over the 10 year period as shown in this graph:
3.) The United Kingdom: The tax and social security burden on labour income in the United Kingdom is very close to the OECD average. Single, average earning taxpayers take home 67 percent of what they cost their employers on average. One earner families with average earnings and two children actually pay slightly more tax than the OECD average. In most cases, the tax wedge rose over the 10 year period as shown in this graph:
If you wish to look up your nation, here is the link for the remaining OECD nations in the study.
It will be interesting to see if the trend of taxation on employment income continues to rise as OECD nations experience a trend of high and rising debts and deficits, reversing the trend of the past decade. It will also be interesting to see if governments try to sell us on the idea that lower corporate taxes are a necessity to keep economies growing, resulting in individuals shouldering a heftier share of the revenue necessary to achieve sovereign fiscal balance.
Click HERE to read more of Glen Asher’s columns.
Article viewed at: Oye! Times at www.oyetimes.com
You can publish this article on your website as long as you provide a link back to this page.

Be the first to comment