This article was last updated on April 16, 2022
Canada: ![]() Oye! Times readers Get FREE $30 to spend on Amazon, Walmart…
Oye! Times readers Get FREE $30 to spend on Amazon, Walmart…
USA: ![]() Oye! Times readers Get FREE $30 to spend on Amazon, Walmart…
Oye! Times readers Get FREE $30 to spend on Amazon, Walmart…
 Most non-professional investors may only have heard of the rather obscure Baltic Dry Index (BDI) in passing. In this posting, I will open by giving a brief rundown on what the BDI is and how it is useful for predicting the world’s economic performance followed by a look at what has happened to the BDI prior to, during and after the Great Recession. I’ll also take a closer look at what has happened to the BDI in recent months, giving readers the chance to see what may lie ahead for the world’s economy in the near future.
The Baltic Dry Index is issued daily by the U.K.-based Baltic Exchange which has been in existence since 1744. The BDI tracks the worldwide international shipping prices of major raw material dry bulk cargoes by sea including grain, iron ore coal and other fossil fuels. The BDI measures the actual shipping costs of these raw materials for four different sizes of merchant vessels on 26 different geographic routes and averages them into one index. As such, it is one of the very few leading, non-speculative, non-revisable economic measures, unlike GDP growth, unemployment and consumer sentiment measures, all of which are lagging indicators. Changes in the BDI are often used by investors to measure changes in the demand for different commodities around the globe. These changes are considered a leading indicator of future economic growth; if the BDI is rising (i.e. shipping prices are rising), there is increased demand for the shipping of commodities by various end users around the world, signalling future economic growth since most of these precursor commodities are generally linked to the eventual production of finished goods like steel and concrete. If the BDI is falling, there is less demand for marine shipping of commodities, indicating that the world’s economy is likely to contract. Basically, the BDI measures the demand for shipping capacity versus the supply of bulk, ocean-going carriers. Because the lead time to build carriers is quite long, small increases or decreases in demand for shipping can result in relatively large upward or downward swings in the BDI.
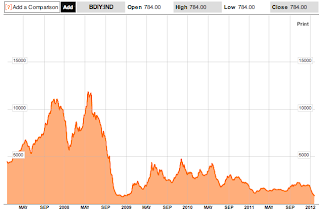
Now, let’s take a longer term historical look at the BDI as shown on this chart:
The BDI hit an all-time high of 11793 on May 20th, 2008. As the Great Recession became entrenched in the world’s economy, the Index fell to a low of 663 on December 4, 2008 for a drop of 94 percent, reflecting a massive plunge in shipping rates as demand for shipping by sea plummeted and rates fell from$233,988 per day to less than $2800 per day.
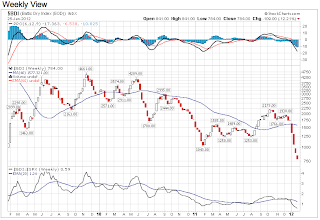
Here is a medium term look at the BDI from January 2009 to the present:
This graph shows us that the BDI peaked at 4661 in November of 2010 as it appeared that the world’s economy was firing on all cylinders after the Great Recession. It dropped to a multi-year low of 1043 in January 2011 as the wheels started to come off the Eurozone (i.e. Portugal and Ireland debt problems).
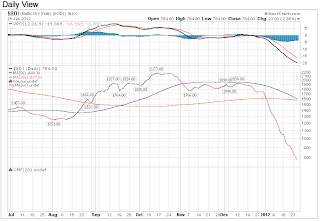
Here is a chart showing the BDI over the last five months:
Back in mid-October 2011, the BDI peaked at 2173, up from 1252 in early August 2011 as the world debt crisis reared its ugly head and remained in a range between 1766 and 2173 until four weeks ago. Since the beginning of 2012, the BDI has fallen very steeply (termed a "long tail down" pattern) to just below 800 (more precisely, 784), a level not seen since the depths of the Great Recession when the BDI hit 666.
It appears that the BDI, which has plunged 64 percent since its most recent peak in October 2011, is indicating that a world-wide recession is on our doorstep, something that many lay people have sensed for some time. Experts are suggesting that the Index may also be reflecting a glut in global ship inventory which can be corrected by ship-scrapping, accelerated new vessel delivery and poor weather in some export markets and even the Chinese Lunar New Year (although, for the sake of consistency, such a decline did not take place in January 2010), however, we may ultimately find out that the rapid decline is, in fact, presaging a rather strong global economic slowdown as the demand for many commodities dries up. Only time will tell us whether the world’s economy is slowing up more quickly than the so-called experts are predicting.
Click HERE to read more of Glen Asher’s columns.
Article viewed on Oye! Times at www.oyetimes.com
You can publish this article on your website as long as you provide a link back to this page.


Be the first to comment