In the Federal Reserve’s latest version of its Household Debt and Credit Report for the third quarter of 2017, we can clearly see how the hard lessons taught by the Great Recession have, for the most part, pretty much been forgotten by the American public.
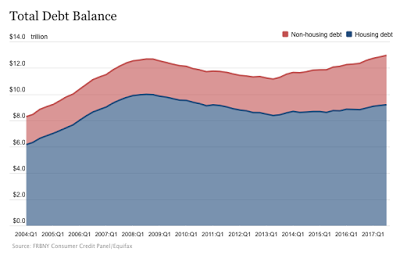
Here is a graphic showing what has happened to aggregate household debt levels since Q1 2004:
In the third quarter of 2017 alone, household debt rose by $116 billion on a quarter-over-quarter basis with total household indebtedness hitting $12.96 trillion. In case you were wondering, this is $280 billion above the peak last hit during the Great Recession in Q3 2008 and is now 16.2 percent above the post-Great Recession trough in Q2 2013.
Mortgage balances are the largest component of household debt and stood at $8.47 trillion on September 30, 2017, $52 billion or 0.6 percentage points higher than the previous quarter.
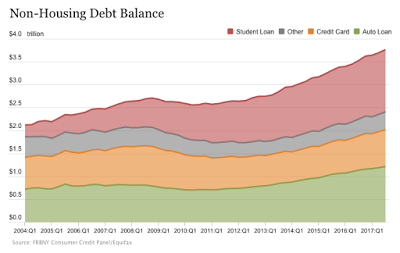
Here is a breakdown of non-housing household debt:
Non-housing debt balances have been increasing for the past six years, rising by $68 billion in the third quarter of 2017 alone. On a quarter-over-quarter basis, auto loans grew by $23 billion or 1.9 percent, credit card debt grew by $24 billion or 3.1 percent and student loans grew by $13 billion or 1.0 percent.
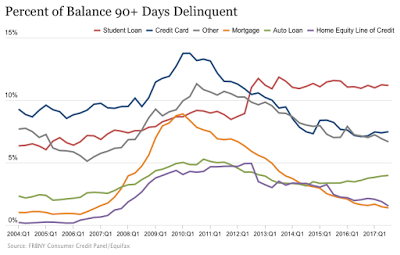
Let’s look at debt delinquency rates for six types of loans/debt:
The Federal Reserve notes that aggregate delinquency rates rose slightly in the third quarter of 2017, hitting 4.9 percent, up from 4.8 percent in the second quarter of 2017. At this point, $630 billion in debt is delinquent with $480 billion being seriously delinquent (late by 90 days or more). The flows into credit card debt that are more than 90 days delinquent have been increasing notably over the past year (dark blue line), hitting 4.6 percent and the flow into auto loans that are seriously delinquent has been rising since 2012 (green line), hitting 2.4 percent. Mortgages that were more than 90 days delinquent fell to 1.4 percent in the third quarter of 2017, down from 1.7 percent at the beginning of 2017 and well down from the peak of 8.9 percent in 2010. While seriously delinquent student loan rates dropped slightly on a quarter-over-quarter basis, a very substantial 9.6 percent of student loans were in serious jeopardy.
On an aggregate basis, it is interesting to see that Americans as a whole are now more indebted than they were during the Great Recession. It appears that the Federal Reserve’s “monetary medicine” of near-zero interest rates has worked its magic on the economy; consumers have been lulled into spending like there’s no day of debt reckoning. While current debt delinquency rates look relatively healthy for the most part, the current household debt reality is a house built on sand. When interest rate increases really take hold, millions of American households that have basically no savings will find themselves living like it’s 2008 all over again.
Click HERE to view more.
You can publish this article on your website as long as you provide a link back to this page.


Be the first to comment