An analysis by the National Employment Law Project (NELP) looks at the relationship between job losses during the most recent recession and the wages paid in the jobs lost versus the jobs gained in the early part of the recovery. NELP surveyed the wage data for 785 occupations across the United States, divided the data into five groupings (quintiles) and then used the median wage data or the midpoint between the highest and lowest wage in each quintile.
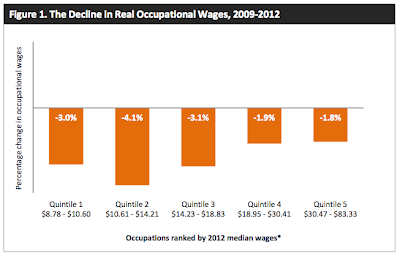
Here is a summary bar graph showing their findings:
You'll notice that between 2009 and 2012, the percentage change in real median wages for the bottom three quintiles (20 percent groupings) was the highest, ranging between a loss of 3 percent and a loss of 4.1 percent. Earners in the hourly range of $10.61 to $14.21 saw their real median wages shrink by 4.1 percent over the period. In contrast, earners in the top quintile with median wages ranging from $30.47 to $83.33 per hour saw their wages shrink by "only" 1.8 percent over the four year period. The data for the top two quintiles actually shows that nearly one third of the occupations in this bracket saw real wage growth.
Across all occupations, NELP estimates that real median wages declined by 2.8 percent between 2009 and 2012, a rather shocking finding given that productivity actually rose by 4.5 percent over the same timeframe. As you can see on this graph from FRED, the output per person over the four year period rose from 102.1 (indexed to 2005 = 100) to 111 at the end of 2012, an improvement of 8.7 percent:
Notice the strong divergence between compensation and productivity?
Which occupations were particularly hard hit? Here's a list showing the occupation, median hourly wage and percentage change in median wage between 2009 and 2012:
Restaurant Cooks ($10.59): -7.1 percent
Personal Care Aides ($9.57): -5.5 percent
Food Preparation Workers ($9.28): -5.2 percent
Home Health Aides ($10.01): -5.0 percent
Maids and Housekeeping Cleaners ($9.41): -5.0 percent
Retail Salespersons ($10.15): -2.6 percent
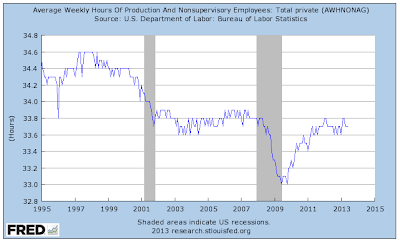
It's interesting to observe that American workers who are at the bottom of the wage pyramid are those who have seen their real wages shrink by the highest percentage. To heap insult upon injury, the Economic Policy Institute notes that the length of the average workweek is 33.7 hours, still slightly below the level seen before the Great Recession and well below the levels seen in the earlier part of the new millennium:
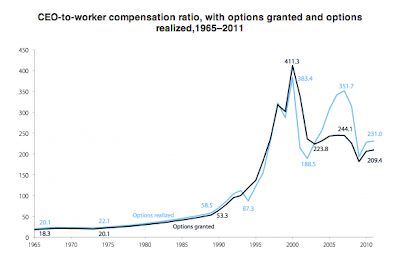
In closing, here's a graph showing what has happened to the compensation levels for the lucky few souls that dwell in the upper floor, corner offices:
At least we know that all of that money saved on compensation and the efforts put into increasing productivity is going to good use. As I recall being told many times, we're all just lucky to have a job!
Click HERE to read more of Glen Asher's columns
You can publish this article on your website as long as you provide a link back to this page.


Be the first to comment