An interesting analysis by Express Employment Professionals takes an in-depth look at the "State of the Unemployed" in America. This is Express Employment Professional's second annual in-depth poll which looks at the details behind America's8.549 million unemployed workers and 2.525 million long-term unemployed workers. The poll was conducted over the month of April 2015 and surveyed 1553 jobless Americans. Here are the results.
Let's start with who the unemployed are:
1.) 57 percent are men, 43 percent are women.
2.) Here is a bar graph showing the percentage of the total unemployed by age range:
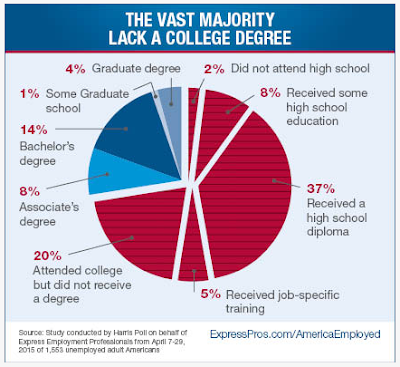
3.) The majority of unemployed Americans lack education beyond high school as shown on this pie chart:
Most significantly, 37 percent of Americans that are unemployed have received only a high school diploma with an additional 8 percent receiving some high school education and 2 percent not attending high school. This means that 47 percent of unemployed Americans have high school education or less. In contrast, 27 percent of unemployed Americans have either an associate's degree, bachelor's degree, some graduate school or a graduate degree.
4.) The average duration of unemployment has risen over the past year, increasing from 23.2 months in 2014 to 26.8 months in 2015. Here is a bar graph showing the percentage of unemployed Americans by duration:
It is astounding to think that, six years into the "recovery", 41 percent of unemployed Americans have been out of work for more than two years.
5.) The survey shows that it is also a very discouraging job market. A total of 40 percent of unemployed workers surveyed agreed that they have given up looking for work. In general, the longer that a person has been unemployed, the more likely that they have given up looking for work. Breaking the data down further by duration of joblessness, here are the percentages of those that have given up looking for work by duration of unemployment in graph form:
6.) Of those that are unemployed, there is a wide variation in the length of time spent looking for work (in the previous week):
19 percent spent no time
24 percent spent one to five hours
18 percent spent six to ten hours
20 percent spent eleven to twenty hours
9 percent spent twenty-one to thirty hours
10 percent spent over thirty hours
A rather stunning 48 percent of those that are unemployed have not had an interview in the month prior to the survey with 82 percent of those not having a single interview since the beginning of 2014 or earlier and 77 percent not having a single interview since 2013. Of all unemployed Americans, 48 percent would take any job that was offered to them. As well, among unemployed Americans, only 14 percent are receiving unemployment benefits.
While statistics show a relatively continuous improvement in the employment picture in the United States, this data shows us that there are still a significant proportion of very long-term unemployed Americans who are suffering as though the Great Recession had never ended. What is particularly concerning is that, statistically speaking, the next economic contraction could occur at any time.
Click HERE to read more of Glen Asher's columns
You can publish this article on your website as long as you provide a link back to this page.


Be the first to comment