With Ontario’s 2012 – 2013 budget is here, I thought that it was time to take a look at Ontario’s fiscal past to see just how prudent various governments of various political parties have been since 1986.
As a reminder, particularly for those of you who have either forgotten or never knew, here is an outline showing the terms, Premiers and political persuasions of those who have ruled Ontario as their fiefdom:
1985 – 1987 David Peterson – Liberal (minority)
1987 – 1990 David Peterson – Liberal
1990 – 1995 Bob Rae – NDP
1995 – 1999 Mike Harris – Progressive Conservative
1999 – 2003 Mike Harris – Progressive Conservative
2003 – 2007 Dalton McGuinty – Liberal
2007 – 2011 Dalton McGuinty – Liberal
2011 – present Dalton McGuinty – Liberal (minority)
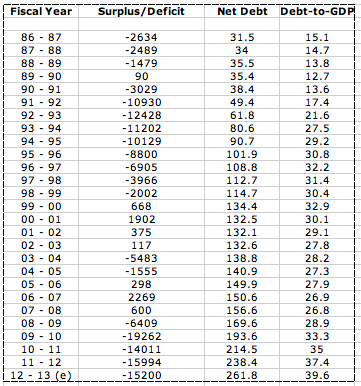
Now, let’s look at some fiscal history for the province, sourced from the TD Bank as shown on this chart:
Now let’s look at some graphical representations of the data starting with the surplus/deficit picture for each year:
You’ll notice that out of the 27 fiscal years represented, that the budget has been in surplus for only eight years or 29.6 percent of the time. As well, over the multi-decade sampling, deficits have outweighed surpluses to the point that the various governments have accrued an additional $147.588 billion in deficit spending.
Now let’s look at the growth in net debt:
Since the turn of the century, the debt has grown from $132.5 billion in fiscal 2000 – 2001 to $238.4 billion in fiscal 2011 – 2012, a 79.9 percent increase.
Lastly, let’s look at the change in the debt-to-GDP ratio:
It’s really only been since fiscal 2008 – 2009 that the debt-to-GDP level has risen markedly unless we look back to the days before Mike Harris and his highly unpopular and painful austerity cutbacks in the mid-1990s. Since 2008 – 2009, the debt-to-GDP ratio has risen from 28.9 percent to an estimated 39.6 percent in 2012 – 2013, a rise of 37 percent. While this debt-to-GDP level seems low when we compare it to what we have seen in the Eurozone over the past year, we have to remember one thing; provincial and state governments have much lower tolerances for debt accrual than federal governments, largely because their ability to tax is limited. Bond ratings agencies and bond markets have already expressed concerns about Ontario’s debt level with Moody’s already threatening a debt downgrade back in December 2011.
Let’s hope that the McGuinty government finally takes its role as fiscal caretaker of Ontario’s future seriously and ends their spend and tax philosophy before austerity is forced upon them. Ontario’s fiscal history has been far from a pretty one over the past twenty-five years and now, Ontarian’s are being forced to pay for the mistakes of past governments.
Click HERE to read more of Glen Asher’s columns.
Article viewed on Oye! Times at www.oyetimes.com
You can publish this article on your website as long as you provide a link back to this page.


Be the first to comment