The Next Recession – When Will it Occur and How Painful Will it Be?
Throughout modern history, one measure has very accurately predicted the likelihood of a recession. This measure was pioneered as an indicator of future economic growth by Dr. Campbell Harvey, a Canadian economist who is currently a professor of finance at Duke’s Fuqua School of Business. In a paper entitled “The Term Structure and World Economic Growth” which appeared in the 1991 premier issue of The Journal of Fixed Income, Dr. Harvey postulated that:
“…interest rates provide a window on future economic growth in that interest represents the rate at which people are willing to trade consumption today for, consumption tomorrow. This rate is fundamentally linked to expectations of economic growth.“
In this ground-breaking paper, Dr. Harvey states that the shape of the term structure of interest rates (i.e. the difference between short-term rates and long-term rates) in the market will provide a forecast of the levels of future economic growth. This is largely the case because, like stock market prices, bond prices (and, by extension, interest rates) are forward-looking.
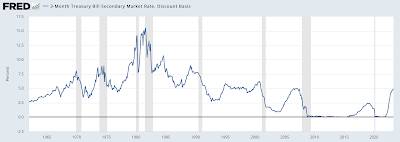
The Federal Reserve Economic Data (FRED) website provides us with the data necessary to examine Dr. Harvey’s theory. First, here is a chart showing the interest rates on 3-month Treasury Bills going back to the beginning of 1962:
Note the sharp increase in 3-month interest rates since the beginning of 2022 when the Federal Reserve began its monetary program to defeat rising inflationary pressures in the United States.
Here is a chart showing the interest rates on 10-year Treasuries going back to the beginning of 1962:
Once again, you can see the increase in 10-year interest rates since the beginning of 2022.
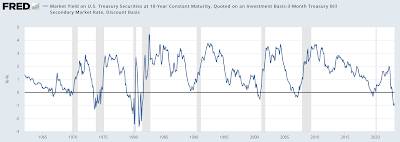
Now, let’s overlay the two charts by subtracting the 3-month Treasury interest rate from the 10-year Treasury interest rate noting that the shaded areas represent recessions:
Throughout the past 60 years, just prior to a recession, the 10-year/3-month spread is negative, in other words, the yield curve is inverted with long-term yields being below those of a shorter term. The current spread is the most negative since the twin recessions that occurred between Q2 1979 to Q3 1980 and Q2 1981 to Q3 1982. The current spread suggests that a deep recession is likely in the near future, however, the spread does not have the ability to predict exactly when the recession will take place.
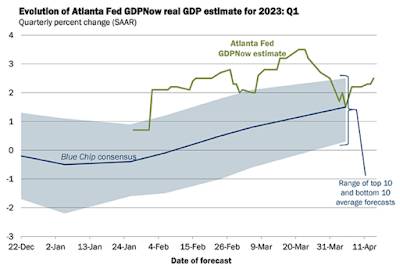
As an aside, the Atlanta Fed has a model for estimating real GDP growth called GDPNow. Here is the latest prognostication for the first quarter of 2023 using this tool which is constructed by aggregating statistical model forecasts of 13 subcomponents that make up GDP:
On average, the GDPNow model predicts real GDP growth of 2.5 percent for Q1 2023 (up from 2.2 percent in the previous week) with a range of between 0.3 percent and 2.5 percent.
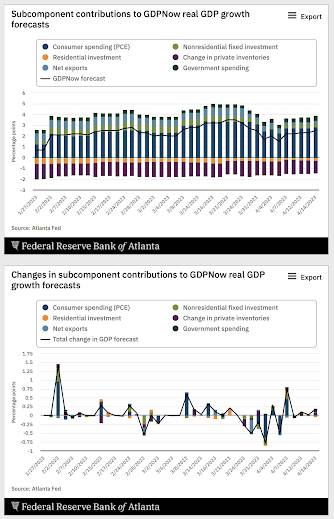
Here are the components of the data that is used by the GDPNow model:
So, will there be a recession? The GDPNow model suggests that economic growth in Q1 2023 will be fairly robust. This is in contrast to the current spread between 10-year and 3-month Treasuries which are predicting that there will be a recession in the near future and that it will be a rather deep economic contraction.
But, then again, when did central bankers ever foresee any economic catastrophe, recalling their latest blunder with “transient inflation”.


Be the first to comment