Back in June 2015, I posted an article that looked at the Transportation Services Index or TSI, a broad measure of America's transportation services which includes the monthly changes in both passenger and freight transportation. The freight component (the freight TSI) includes freight that moves by highway, rail, air, water and pipeline, the main subject of this posting. The most interesting aspect of the Transportation Services Index is that it functions as a leading indicator of the strength of the economy, that is, a deceleration or decline in the index is predictive of economic downturns. Let's look at the most recent index and take a closer look at what has happened to rail traffic over the past year.
What is Freight Telling Us About the Economy?
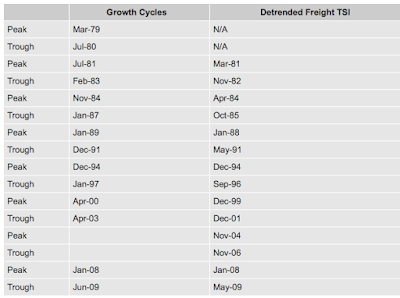
As background, a 2009 study which was updated in 2014, by Peg Young and Ken Notis at the United States Department of Transportation showed that, over the past three decades, the freight TSI showed either a deceleration or decline at least four to five months before economic downturns as shown on this table:
In the case of the Great Recession, the freight TSI showed a decline or deceleration 18 months prior to the start of the last major recession. This makes common sense; as consumers and businesses start to reduce their spending, the amount of freight movement that is required to satisfy consumer and business demand either remains steady or falls, slowing economic growth levels.
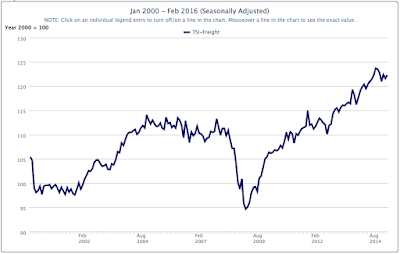
Now, let's look at what has happened to the freight TSI since 2000:
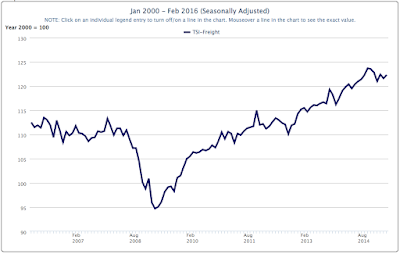
Let's focus on the period from 2006 on:
You can easily see how the freight TSI dropped substantially during the Great Recession. You can also see how the freight TSI peaked in mid-2006 and again right at the beginning of the latest recession in January 2008 but grew very little over the period from late 2004. As the economy began to expand in mid 2009, the freight TSI began to rise and continued its climb until the end of 2014.
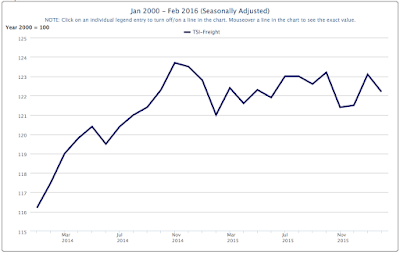
Now, let's focus on the period between between the beginning of 2014 and February 2016:
Basically, the level of the freight TSI has been decelerating since November 2014 and is starting to resemble the pattern shown prior to the Great Recession when there was a significant lead time between the deceleration and the start of the last recession.
Let's look at one key component of the freight TSI, the freight that is moved using rail. The U.S. Department of Transportation sources its rail data for the freight TSI from the Association of American Railroads. In its latest weekly rail traffic report, the AAR reports the following for the month of April 2016:
1.) Carload traffic in April totalled 944,339 carloads, down 16.2 percent or 180,598 carloads from April 2015
2.) Container traffic in April 2016 totalled 1,028,460 containers and trailers, down 7.5 percent or 83,729 units from April 2015.
3.) Five of the 20 carload commodities saw gains over April 2015; miscellaneous carloads were up 25 percent, coke was up 16.1 percent and chemicals were up 1.5 percent. Commodities that saw year-over-year declines included coal which was down 39.7 percent, petroleum and petroleum products were down 25.1 percent and grain mill products were down 7.1 percent.
4.) Total carload traffic for the first 17 weeks was down 14.3 percent compared to the same period in 2015.
5.) For the first four months of 2016, total rail traffic volume in the United States was 8,455,752 carloads and intermodal units, down 7.8 percent or 715,985 carloads and intermodal units from the same point last year.
The rather significant drop in rail traffic and the deceleration in the growth of the freight TSI certainly give us a sense that the economy is likely to continue to slow or remain rather stagnant for the foreseeable future, an economic reality that became evident with the release of the first quarter GDP data.
Click HERE to read more of Glen Asher's columns
You can publish this article on your website as long as you provide a link back to this page.


Be the first to comment