 For the past month or thereabouts, the mainstream media has heavily covered the debt situation in both the United States and the Eurozone. That’s proven to be fortunate for the world’s second largest debtor nation in terms of both nominal debt and their debt-to-GDP ratio. This nation’s debt is substantially larger than that of the entire EA-16 (euro area) sovereign debt combined and they have the second highest debt-to-GDP ratio in the world yet, recently, I have seen very little coverage of this country in the business section of the world’s newspapers.
In it’s most recent data release in early August, Japan’s Ministry of Finance reports that they have a total of ¥9,438,096,000 million in government bonds and outstanding borrowing on June 30th, 2011 which they term "Central Government Debt". For those of you that aren’t familiar with those really big yen numbers, that works out to $12.2573 trillion using a conversion of ¥77 to the United States dollar. That’s up ¥194,500,000 million or $252.597 million from the previous quarter. Japan’s debt was last downgraded by the esteemed Standard & Poor’s in January 2011 from AA to AA-minus and Moody’s warned of a possible downgrade by putting Japan’s Aa2 rating on review. Interestingly enough, according to a report in the Financial Times, after the downgrade in January, foreigners snapped up Japanese bonds at a rate that was higher than in the previous three months! This is very similar to what happened just after S&P downgraded the United States’ debt; Treasury prices rose and yields declined as investors fled to "safety". Apparently, investors seem not to care what the ratings agencies have to say.
Here is a bar graph showing the rise in Japan’s sovereign debt since the mid-1960s:
Notice that the long-term debt at the end of fiscal 2011 is expected to reach 184 percent of GDP by the reckoning of Japan’s own government. That puts Japan in the unenviable second place position in the debt-to-GDP race after the fiscally responsible government of Robert Mugabe, Esteemed Leader of Zimbabwe.
Japan is in the fortunate situation that most of its government debt is owned by its own citizens. In fact, as shown on this graph, only approximately 5 percent of Japan’s government bonds are held by non-Japanese citizens:
This is in sharp contrast to the United States where approximately 50 percent of its sovereign debt is held overseas making the U.S. more vulnerable to overseas bond holders selling their holdings en masse, pushing prices down and yields up.
Japan’s proposed budget for fiscal 2011 was set in December of 2010 and expenditures were expected to drop by only 0.1 percent from the previous year. Debt service charges are up modestly on a year-over-year basis to ¥21,549.1 billion, consuming 23.3 percent of the total budget. Social Security expenditures are projected to rise by 5.3 percent (the highest percentage increase on a year-over-year basis) to ¥28,707.9 billion, consuming 31.1 percent of the total budget, the largest single expenditure as shown on this pie chart:
Social Security payments in Japan have risen from 11.1 percent of the total budget in 1960 to 16.6 percent in 1990 and 19.7 percent in 2000. Japan has one of the world’s oldest populations and its aging demographic will be experienced by many nations of the world as the baby boomer generation slowly but surely reaches their senior years.
This graph shows how expenditures (shown with a purple line) have increasingly outstripped tax revenues (blue line) since the mid-1970s:
The bars show government bond issuances that have been used to fill the gap between revenue and expenditure. It is interesting to note that the number of government bonds issued has risen markedly since the early 1990s when less than ¥7.5 trillion of bonds were issued on an annual basis. For the past 3 years including the projection for 2011, the number of bonds issued on an annual basis has risen to an average of ¥46.9 trillion ($609 billion).
The March 11th earthquake also had a massive impact on the government’s bottom line. On April 22nd, 2011, the Japanese government issued a Supplementary Budget to cover expenditures related to restoration of the areas affected. The total estimated expense reached ¥4015.3 billion or $52.15 billion, an increase of 5.67 percent on a budget that was originally set at ¥70,862.3 billion for the entire fiscal 2011 year. It’s interesting to see how a natural disaster can throw off a country’s plans for fiscal improvement. One need think only of the impact of a bad hurricane season to note the impact on America’s economy and accompanying government emergency expenditures.
Despite all of this fiscal imbalance, Japan’s interest rates are extremely low. Here’s a graph showing Japan’s 10 year bond rate since 1987:
Notice how the rate has dropped to below 2 percent and remained stable at that level since the late 1990s? That low interest rate has been responsible for Japan’s federal government remaining solvent.
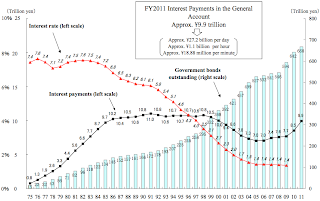
Here’s an interesting graph showing how the interest rate on Japans Government Bonds has dropped over the past 35 years from 7.4 percent in 1975 to 1.4 percent in 2009:
As in the case of the United States, if interest rates in Japan were to rise to normal historical levels, both countries would find themselves in a dire situation as interest payments on their sovereign debt would rise at the same time as outlays for baby boomer social programs were rising. My suspicion is that as interest payments rise, many governments around the world will be forced to decide whether to pay their creditors or cut spending on social entitlement programs…or both.
Welcome to our future.
Click HERE to read more of Glen Asher’s columns.
Article viewed at: Oye! Times at www.oyetimes.com
You can publish this article on your website as long as you provide a link back to this page.


Be the first to comment