No it's not your imagination, there really are two Americas….at least according to a new study by the Brookings Institute entitled "America has two economies – and they're diverging fast" by Mark Muro and Jacob Whiton.
The authors open with this observation:
"We’ve been harping for a while on the stark economic divides that define American life in the Donald Trump years.
To be sure, racial and cultural resentment have been the prime factors of the Trump backlash, but it’s also clear that the two parties speak for and to dramatically different segments of the American economy. Where Republican areas of the country rely on lower-skill, lower-productivity “traditional” industries like manufacturing and resource extraction, Democratic, mostly urban districts contain large concentrations of the nation’s higher-skill, higher-tech professional and digital services."
Based on a new data analysis that was developed with the Wall Street Journal's Aaron Zitner and Dante Chinni, the authors suggest that the change being experienced in the red and blue United States is happening very quickly and in real time, transforming the economies of the Democrats and Republicans.
Let's start by looking at how voting patterns have changed over the past decade by examining several metrics:
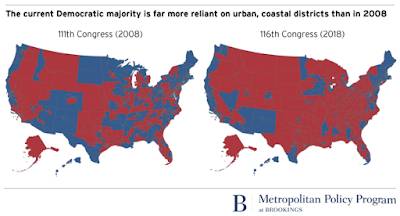
1.) Land Area: This map shows that the Democrats are far more reliant on urban, coastal districts than they were in 2008:
In 2008, Democratic-voting, urban districts encompassed 39 percent of America's land area compared with 61 percent the land area voting Republican. By 2018, the Democrat's share of America's land area had fallen to 20 percent with the Republican's share rising to 80 percent.
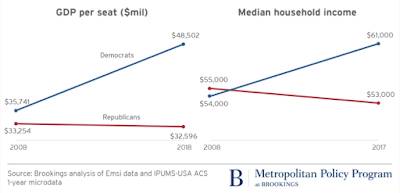
2.) Median household income and GDP per seat: GDP per seat and median household incomes have changed drastically for Democratic and Republican districts:
Democratic districts GDP per seat:
2008 – $35.74 billion
2018 – $48.50 billion
Republican districts GDP per seat:
2008 – $33.25 billion
2018 – $32.60 billion
Democratic districts median household income:
2008 – $54,000
2018 – $61,000
Republican districts median household income:
2008 – $55,000
2018 – $53,000
Here is a graphic showing the aforementioned data which clearly shows how Republican-leaning districts have seen declines in both GDP per seat and median household income over the past decade:
3.) Productivity: Productivity has varied greatly over the past decade with Democratic districts showing marked improvement and Republican districts productivity remaining stagnant:
Democratic districts productivity:
2008 – $118,000
2018 – $139,000
Republican districts productivity:
2008 – $109,000
2018 – $110,000
4.) Share of adults with at least a Bachelor's degree: Over the past decade, the percentage of people living in Democratic districts have seen a significant increase in the percentage of people attaining a Bachelor's degree or greater compared to a very small increase in Republican districts:
Democratic districts share with Bachelor's degree:
2008 – 28.4 percent
2018 – 35.6 percent
Republican districts share with Bachelor's degree:
2008 – 26.6 percent
2018 – 27.8 percent
5.) Metro area population share: Over the past decade, the Democratic Party represents an increasingly urban population while the Republican Party represents a more rural and exurban population:
Democratic districts metro population share:
2008 – 86.7 percent
2018 – 94.6 percent
Republican districts metro population share:
2008 – 82.7 percent
2018 – 75.6 percent
6.) Basic manufacturing job share: Over the past decade, the percentage of people involved in the manufacturing sector has increased for Republican districts and decreased for Democratic districts as workers in Democratic districts increasingly took jots in professional and digital services:
Democratic districts manufacturing job share:
2008 – 53.8 percent
2018 – 43.6 percent
Republican districts manufacturing job share:
2008 – 46.2 percent
2018 – 56.4 percent
With this data in mind, let's look at what the authors' conclude:
"…there are few signs of any coming reversal of the decade’s divergence. Instead, the current economic trends underlie the current party divide and reinforce it. For at least the foreseeable future, therefore, the nation seems destined to struggle with extreme economic, territorial, and political divides in which the two parties talk almost entirely past each other on the most important economic and social issues, like innovation, immigration, and education because they represent starkly separate and diverging worlds. Not only do the two parties adhere to very different views, but they inhabit increasingly different economies and environments."
Election results in the United States are increasingly showing that the United States of America is becoming the Untied States of America. From all appearances, a commentary by Ronald Brownstein in "The Atlantic" which stated the following:
"Today, the two parties represent no only different sections of the country, but also, in effect, different editions of the country….The parties' ever-escalating conflict represents not only an ideological and partisan stalemate. It also encapsulates our collective failure to find common cause between what America has been, and what it is becoming."
Click HERE to read more from this author.
You can publish this article on your website as long as you provide a link back to this page.


Be the first to comment