Along with the monthly unemployment data, the Bureau of Labor Statistics (BLS) releases a monthly review showing the number of jobs available to Americans. The Job Openings and Labor Turnover Survey News Release(or JOLTS) reveals the number of job openings available to the American workforce along with the number of hires and the number of separations.. Without significant job openings, underemployed and unemployed Americans don't have a hope of removing themselves from their unfortunate unemployment situation.
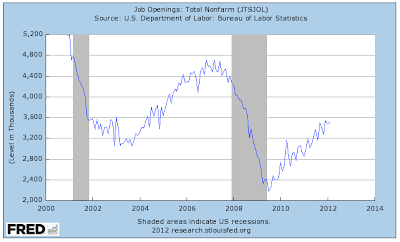
Let's open by looking at a graphshowing the number of job openings since 2000 according to FRED:
You'll notice that the number of job openings plummeted from a peak of 4.69 million in June of 2007 to a low of 2.186 million in July of 2009 during the depths of the Great Contraction, a drop of 53.3 percent. Since then, the number of job openings has slowly but surely increased, however, it is still well below the levels experienced during the period between June of 2005 and March of 2008 when it was above 4 million every month. In fact, the February 2012 level of 3.498 million jobs is reminiscent of the levels seen back in 2004 and is still between 20 and 25 percent lower than the average just prior to the Great Recession . As well, in recent months, the number of job openings seems to have stalled at a level below 3.5 million which was achieved in September 2011.
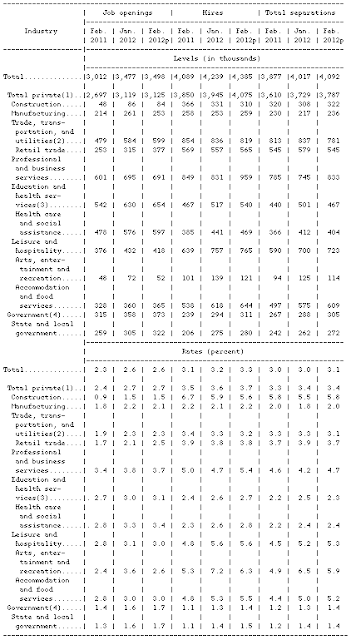
Here is a chart from the BLS comparing job openings, the number of hires and the number of separations (those who quit, are involuntarily laid off and retirements) in various industries to those seen historically:
The hiring rate was essentially unchanged from the previous month at 3.3 percent and was up marginally from 3.1 percent a year earlier. The total number of hires in February 2012 was 4.4 million, still 12 percent below the pre-recession rate of 5 million. The hiring rate improved most on a month-over-month basis for professional and business services and dropped the most on a year-over-year basis for construction, falling from 6.7 percent in February 2011 to 5.6 percent in February 2012.
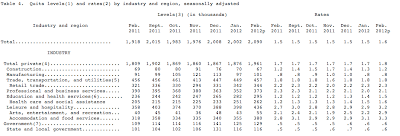
Here is a chart showing the most recent quits rate data which measures how willing or able workers are to change jobs:
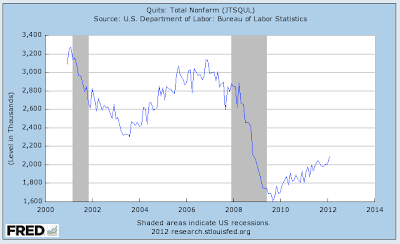
Here is a graph from FRED showing how the quits rate is still below the decade-long low from 2003 showing how difficult it is to change jobs even three years into the "recovery":
In February of 2012, 2.1 million workers quit their current jobs, up from a low of 1.8 million in June of 2009 at the end of the Great Recession but well below the pre-recession rate of 2.9 million recorded in December of 2007. On a year-over-year basis, the number of quitting workers has remained relatively stagnant, increasing by only 0.1 percentage point from 1.5 to 1.6 percent. In looking through the various industries, you will notice how few construction workers are quitting their current jobs, a not particularly surprising sign of weakness in the housing and general construction industry.
It is always interesting to look at the statistics behind the headline unemployment rate data. The JOLT data pretty much summarizes the current state of the economy; this has been a particularly modest recovery on the employment side of the ledger despite Mr. Bernanke's massive stimulus. This data also suggests that it is unlikely that we will see improvement in the employment situation in the coming months since it would appear that the jobs simply are not being created.
Click HERE to read more of Glen Asher's columns
You can publish this article on your website as long as you provide a link back to this page.


Be the first to comment