 Demographia released its 7th Annual Demographia International Housing Affordability Survey: 2011 for major metropolitan markets in Australia, Canada, Ireland, New Zealand, the United Kingdom, the United States and Hong Kong. The data in the survey is current to the third quarter of 2010 and covers 325 markets in the aforementioned 7 nations including 82 major metropolitan markets with populations in excess of 1 million people. The report is authored by Joel Kotkin, a Distinguished Presidential Fellow in Urban Futures at Chapman University.
Housing affordability is critical to the welfare of families around the world. Since the highest single household expense is generally for housing, markets where housing costs form a greater portion of total expenditures means that households have less money to spend on other necessities. As well, housing affordability has changed in many markets around the world. House price escalation has outstripped household income in many areas of the world, making housing increasingly unaffordable in many markets in Australia, New Zealand and the United Kingdom.
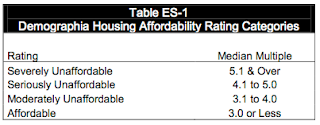
Demographia defines affordability as the median multiple as calculated by dividing the median house price by the gross annual median household income in that market. The median multiple is then divided into affordability rating categories as follows:
Note that the study considers homes "severely unaffordable" where the median house price is greater than 5.1 times the median household income.
The authors of the survey notes that in certain specific markets within some major urban centres and some suburban areas,for example New York City’s Upper East Side, Vancouver’s Kitsilano and London’s Mayfair, can tolerate high ratios because markets in these areas are of interest to high income, high net worth, "elite" clientele who are basically unconcerned about the price of real estate but that these neighbourhoods are exceptions to the affordability rule. That said, in general, the study found that housing in most markets within Canada and the United States to be the most affordable and that markets in the United Kingdom, Australia and New Zealand tend to be pervasively unaffordable.
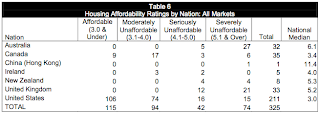
In looking at the statistics for the 82 major metropolitan markets (over 1 million people), Demographia found that there were 20 affordable major markets, 25 moderately unaffordable major markets, 13 seriously unaffordable major markets and 24 severely unaffordable markets. All 20 affordable major markets were located in the United States and of the severely unaffordable markets, the United Kingdom had nine (out of sixteen), Australia had five (out of five), the United States had five (out of fifty-two) and Canada had three (out of six). As well, New Zealand’s only major market, Auckland, was severely unaffordable as was Hong Kong. Here is a chart showing the housing affordability for major urban markets by nation:
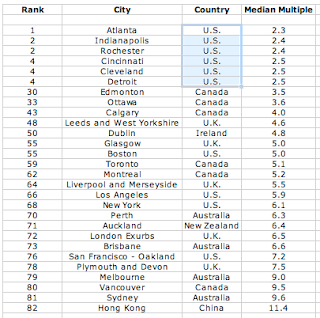
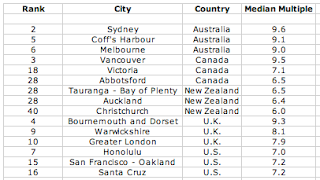
The most affordable major market in the United States was Atlanta with a median multiple of 2.3 and a median house price of $129,400 followed by Indianapolis, Rochester, Cincinnati, Cleveland and Detroit. Last year’s most unaffordable major market, Vancouver, Canada has fallen to third place after Hong Kong and Sydney, Australia, last year’s second least affordable major market. Here are the median multiples for some of the world’s major markets and their rank:
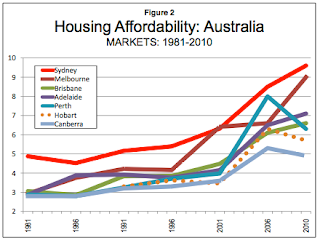
If we look at all 325 markets studied in the Demographia report, Australia has by far the most unaffordable real estate outside of Hong Kong. Of the 32 markets, 27 are considered severely unaffordable with a national median multiple of 6.1. Here is a graph showing how housing has become increasingly unaffordable over the past 30 years in Australia’s major markets:
Overall, of the seven nations studied, the most affordable housing is in the United States; of the 211 markets studied, 106 have affordable housing with only 15 being considered severely unaffordable with a national median multiple of 3.0.
Here is a chart showing overall housing affordability in all 325 markets sorted by country and affordability:
The most affordable housing, when looking at all 325 markets, was found in Saginaw, Michigan which had a multiple of 1.6 followed by Flint, Michigan and Youngstown, Ohio which both had multiples of 1.7. The most affordable housing in Canada was found in Windsor, Ontario which had a multiple of 2.1 (10thplace overall). No markets in New Zealand, the United Kingdom and Australia had multiples of 3.0 or less (which are defined as affordable).
Here is a chart showing the three most affordable markets in the United States and Canada and their overall ranking:
The most severely unaffordable housing was found in Hong Kong which had a median multiple of 11.4. This has only been exceeded twice before in the seven years that Demographia has issued their report, both times by Los Angeles which came in at 11.5 in 2007 and 11.4 in 2006. Here are the three most unaffordable markets in each nation (other than China/Hong Kong). Notice how housing is extremely unaffordable in the least affordable markets in Australia compared to the overpriced markets in the other four nations:
It is well worth the time to read the entire Demographia reportor, at the very least, look through the charts to see where your own market fits into the overall affordability picture. Most of us already have a sense of how affordable housing is in our home city but it is most interesting to see how Demographia uses median household income to define housing affordability, a most practical way of measuring whether or not average households can afford their own housing. Since incomes rarely drop (except in cases of unemployment or underemployment), it is enlightening to see how housing has become far less affordable as housing prices have escalated well beyond increases in income. One certainly has to wonder how sustainable current house prices will be in markets where Demographia considers median house prices to be severely unaffordable; certainly housing will not become more affordable as a result of major increases in household income.
In future postings, I will examine some of the markets found at either end of the spectrum.
Click HERE to read more of Glen Asher’s columns.
Article viewed at: Oye! Times at www.oyetimes.com
You can publish this article on your website as long as you provide a link back to this page.



Be the first to comment