This article was last updated on May 20, 2022
Canada: ![]() Oye! Times readers Get FREE $30 to spend on Amazon, Walmart…
Oye! Times readers Get FREE $30 to spend on Amazon, Walmart…
USA: ![]() Oye! Times readers Get FREE $30 to spend on Amazon, Walmart…
Oye! Times readers Get FREE $30 to spend on Amazon, Walmart…
 Now that the United States is just days away from hitting the statutory debt limit imposed by the debt ceiling, I thought I’d take a quick look at a summary of the issue of the looming "debt bomb" poised to hit the system over the coming decade. We’ve all heard about the $14.3 trillion debt but what if that pile of "merde" was just 12 percent of America’s total debt? Keep reading!
The CATO Institute, a libertarian think-tank based in Washington, D.C. published a Policy Analysis entitled "Bankrupt – Entitlements and the Federal Budget" at the end of March 2011. In this analysis the author, Michael Tanner, looks at the bigger fiscal nightmare facing the United States – yes, the one unimaginably bigger than the $14.3 trillion debt. Mr. Tanner considers the unfunded liabilities of entitlement programs including Social Security, Medicaid and Medicare; when all three of these liabilities are added to the debt, it approaches the $119.5 trillion mark. That’s $385,000 for every man, woman and child in America.
Federal government spending under the Obama and Bush 2 Administrations has doubled over the past 10 years. By 2025, the debt excluding the unfunded entitlement program liabilities will exceed 100 percent of GDP and by 2035, that could rise to 180 percent of GDP. Over the past decade, federal spending on discretionary domestic items has risen by 120 percent and defense spending has risen by 135 percent. While those numbers are alarming, they pale in comparison to what will be required to fund social entitlement programs.
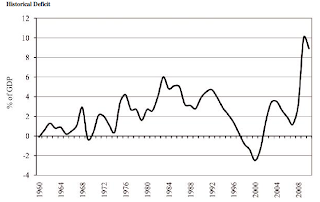
Mounting deficits over the past decade have compounded the American sovereign debt problem. Federal government deficits over the past 3 years have reached record levels. Here is a graph showing the deficit for the past 50 years as a percentage of GDP:
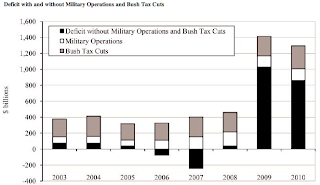
Many observers claim that recent increases in the deficit are due, in large part, to two factors; the Bush tax cuts and the wars in Afghanistan and Iraq. In the case of the tax cuts, the author notes that at least some portion of the tax cut can pay for itself because of changes in personal and business expenditures resulting from the reductions in taxes. In the case of defense spending, the $1.1 trillion spent on two wars since 2001 represents only a small fraction of the total amount of the deficit. Here is a graph showing the impact of both the tax cuts and increased defense spending on the deficit:
Over the past 40 years, federal spending has averaged about 21 percent of GDP and revenues have averaged roughly 18 percent. This leaves a long-term shortfall of 3 percent of GDP on average. By 2009 – 2010, tax revenues were only 14.9 percent of GDP, the lowest since 1950. While some of this can be attributed to the tax cuts, a portion of lower tax revenues is related to the slowdown in the economy during the Great Recession. The Congressional Budget Office estimates that the tax cuts probably accounted for about 2 percentage points of the drop in tax revenue meaning that had the tax cuts not been in place, the deficit would have been 8 percent of GDP rather than 10 percent, not a huge difference.
On the other side of the ledger, as I noted earlier, spending has increased massively under both the Bush 2 and Obama administrations. By 2010, federal government spending reached 24 percent of GDP, down from 25 percent in 2009 but still the two highest spending years since the end of World War II.
When you bring the spending and revenue sides together, even if revenues were to rise to their normal 18 percent of GDP, with spending at 24 percent of GDP, the budget deficit will still be equal to 6 percent of GDP. This tells us that the blame for the deficit lies at the feet of overspending not undertaxing. As well, note that none of these calculations account for future rises in interest owing on the debt, resulting from both rising interest rates and rising overall debt level.
The overall debt level of the government is front page news, especially now that the United States is within days of reaching its debt ceiling of $14.3 trillion. The government classifies its debt in two ways; the debt held by the public and intergovernmental debt. Debt held by the public consists of United States government securities owned by individual investors, foreign governments and other entities outside of the federal government itself. At the end of January 2011, the debt held by the public exceeded $9.46 trillion or roughly 60 percent of GDP. The interest on this debt must be paid in cash meaning that the burden falls on taxpayers to cover these interest charges with their tax dollars. Intergovernmental debt is the debt that the federal government owes itself; the Social Security Trust Fund and Medicare Trust Fund are the two largest holders of intergovernmental debt with a total debt of $2.972 trillion. While this debt does not have to be repaid at any particular point in time, it does ultimately have to be redeemed and the cost of the debt must be reflected in the government’s books according to accepted accounting principles.
There is a third category of government indebtedness that is not widely discussed. The author terms this debt "implicit debt" and it represents the unfunded future obligations of entitlement programs like Social Security, Medicare and Medicaid. This is money that the government will ultimately owe taxpayers. As it stands, the government has a future obligation to pay these benefits to American citizens under current law and, unless Congress acts to change the payment of these benefits, for example by reducing Social Security payments to individuals, the promises show up as debt on the federal government’s ledger.
Currently, Social Securities unfunded obligations are more than $16.1 trillion and Medicare’s unfunded liabilities lie somewhere between $28.7 trillion (with the rather unrealistic spending reductions proposed by under the recent health care bill) and $89.3 trillion (without the reductions in spending from health care reform). If we take the best-case scenario and add the $14.3 trillion debt to the unfunded $16.1 trillion Social Security and $28.7 trillion unfunded Medicare obligations, the total debt reaches $59.1 trillion or 412 percent of GDP. In the worst-case scenario where Medicare savings are not achieved, the debt comes in at a staggering $119.5 trillion or 900 percent of GDP.
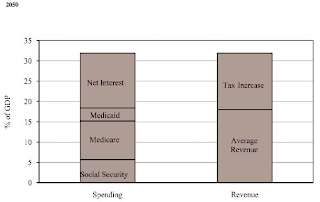
The author estimates that by 2050, Social Security, Medicare and Medicaid will consume 18.4 percent of GDP and, if you recall, normal government revenue is approximately 18 percent of GDP meaning that these three programs will consume all government revenue in 40 short years. If we add in the interest on the debt, government spending rises to 31.9 percent of GDP meaning that a tax hike of 14 percent of GDP will not enable the government to fund any programs beyond Social Security, Medicare, Medicaid and interest payments on the debt as shown here:
As I noted before, all of these projections assume that interest on government debt remains at its current level of 2.2 percent, well below the average rate of 5.7 percent over the past 20 years. If interest rates were to return to normal historical levels, an additional $557 billion would be added to interest costs in the year 2015 alone. Working against the current low interest rate environment could be a perception among debt holders that United States Treasuries are an increasingly risky investment requiring a greater return (i.e. higher interest paid on the Treasuries to offset the perception of risk). This situation becomes extremely dangerous because there can be no certainty whether interest rates will rise sharply as they did in the period from 1979 to 1981 or slowly as in the recent past. The Congressional Budget Office warns that a spike in interest rates similar to 1979 would create huge losses in the world’s bond markets and could lead to the failure of financial institutions similar to what we experienced at the outset of the Great Recession in 2008.
While government spending is necessary, too much of a good thing can stunt economic growth. Mr. Tanner states that governments must provide a certain level of basic services such as infrastructure, defense and security and that if governments spent nothing, there would be much less economic growth. However, where governments spend too much, the disincentive of higher taxes and the crowding out of corporate debt (where a dollar borrowed by the government is no longer available for private use) can stunt economic growth. Currently, federal government spending consumes about 24 percent of GDP and state and local governments spend between 10 and 15 percent of GDP. If there is no change in the level of federal government spending, projections show that by 2050, federal government spending will reach 46 percent of GDP resulting in all levels of government consuming around 60 percent of GDP.
Here is a graph showing the mounting problem of federal government spending over the next 70 years:
Here’s what one senior Chinese banking official, Li Daokui, had to say about the United States debt situation:
“But we should be clear in our minds that the fiscal situation in the United States is much worse than in Europe. In one or two years, when the European debt situation stabilizes, attention of financial markets will definitely shift to the United States. At that time, U.S. Treasury bonds and the dollar will experience considerable declines.”
We know that when governments can continuously borrow and spend, there is no obligation for them to show fiscal discipline and restrain their spending. They know that the taxpayer will always be waiting in the background, wallet in hand.
According to a study entitled "Guessing the Trigger Point for a U.S. Debt Crisis" written by economist Arnold Kling:
"…it would appear to be quite likely that the United States will experience a debt crisis within the next two decades, unless the path for fiscal policy changes from what is projected by the Congressional Budget Office. However, international capital markets continue to treat U.S. Treasury debt as a fairly safe asset. One way to interpret this phenomenon is that investors expect the United States to take steps to get its fiscal house in order.
The assumption that the United States will have the political will to stabilize its fiscal position is based more on hope than on recent experience. If the political process continues to enlarge the government’s commitments to spend in the future, investor expectations will change at some point. That change in market perception is likely to be swift and severe."
Let’s hope that Mr. Kling’s assumption is correct and that the world’s markets continue to grant special treatment to the debt issued by the United States and that the government makes real efforts to get its fiscal house in order…but I wouldn’t count on it. With the looming issue of a $100 trillion unfunded entitlement program issue lurking in the background, the debt problem is certain to become more complex as the years pass. My suspicion is that if and when the United States debt reaches even 400 percent of GDP, the world will be a far different place and that the American way of life will have changed forever. Meaningful changes to entitlement programs will have to take place sooner rather than later if future generations of Americans are to dodge this loudly ticking “debt bomb”.
Click HERE to read more of Glen Asher’s columns.
Article viewed at: Oye! Times at www.oyetimes.com
You can publish this article on your website as long as you provide a link back to this page.


Be the first to comment