There is one aspect of the economy that receives relatively little coverage by the mainstream media. Perhaps because it's not as "sexy" as its employment, GDP and housing data peers, personal savings data seems to make the financial pages only when it is part of a discussion about retirement. In this posting, I'd like to take a look at what has happened to savings by American households over the long-term and since the end of the Great Recession.
Let's start by looking at the personal savings rate, the rate of savings as a percentage of disposable income, since 1959:
Other than the spike to 17 percent in 1975 and the trough to 3.8 percent in 1987, the personal savings rate spent most of the decades between 1960 and 1990 in a range between 7.5 percent and 14 percent, gradually declining as the decades passed. Between 1990 and the Great Recession, the personal savings rate declined from 7.5 percent to a low of 2.4 percent in the mid-2000s. During and immediately after the last recession, the savings rate rose to between 5 and 7.5 percent, however, since the beginning of 2013, it has remained at around 5 percent.
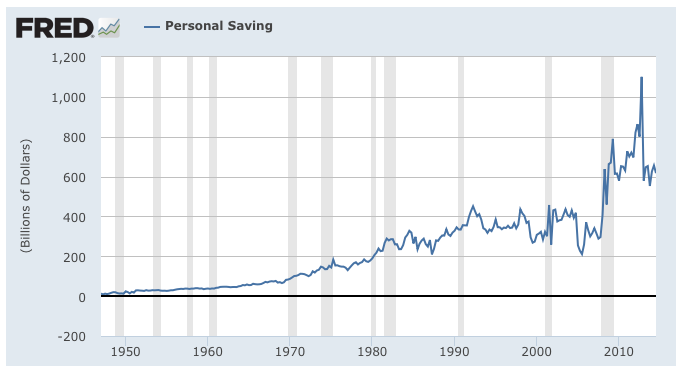
Now, let's look at personal savings since 1947:
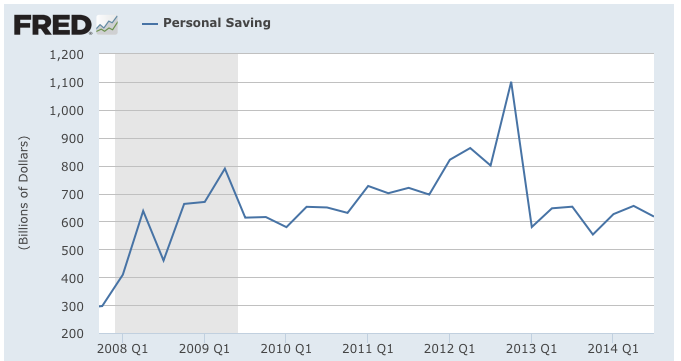
Personal savings grew quite gradually during the decades from the 1950s to the beginning of the Great Recession when savings rapidly grew from just under $300 billion in the fourth quarter of 2007 to $1.1 trillion in the fourth quarter of 2012. What has happened since then is quite interesting as shown here:
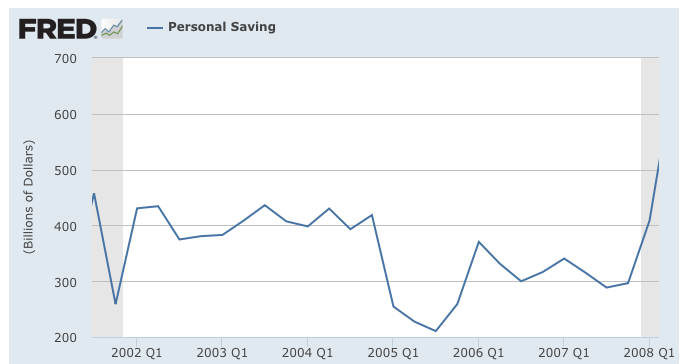
Rather than continuing to grow as it appeared that the economic recovery since the Great Recession was largely an illusion, savings contracted at a record rate. Personal savings fell from $1.1 trillion in Q4 2012 to $579.8 billion in Q1 2013, a drop of 47.3 percent, the second largest percentage drop in history after the drop of 49.8 percent between Q4 2004 and Q1 2005 as shown on this graph:
Now, let's look at one of the main reasons why the savings rate has declined since the Great Recession.
Here is a graph showing interest rates on savings accounts since mid-2009 on non-jumbo deposit (less than $100,000):
There has been no absolutely no reason/motivation to save money in an interest-bearing savings account for the past five years.
Here is a graph showing interest rates on 6 month, 12 month, 24 month, 36 month and 60 month non-jumbo certificates of deposit:
The graphs show that interest rates If we focus on a five year CD, since the end of the Great Recession, interest rates have fallen from 2.23 percent in May 2009 to 0.78 percent at the end of December 2014. If you had invested $90,000 in May 2009, in your first year you would have earned $2007 in interest. If you had invested the same amount in December 2014, you would have earned only $702 in interest, an interest income haircut of 65 percent.
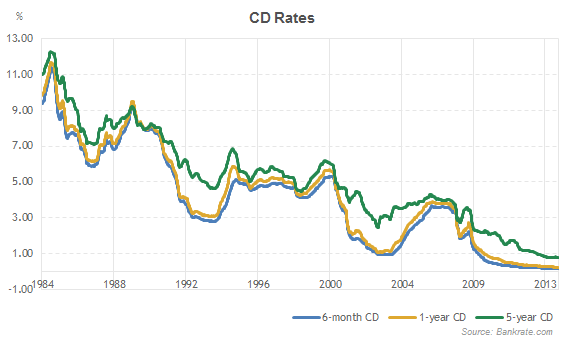
To put this into historical perspective, here is a graph showing the rates on 6 month, one year and 5 year CDs since 1984:
In 2000, the interest rate on 5 year CDs was around 6 percent. At that rate, a $90,000 CD would have earned $5400 in interest in the first year. If you compare that to the current interest earnings of $702, you have experienced an interest income haircut of 87 percent.
The rule of 72 states that if you take 72 and divide it by the interest rate, the result is the number of years that it takes to double your investment. In the case of interest rates of 6 percent, you double your principal in 12 years. If you use the current interest rate on five year CDs of 0.78 percent, it takes 92.3 years to double your investment.
Since individuals, particularly savers, have not benefitted from the Fed's long-term experiment with, who has? Here are the beneficiaries:
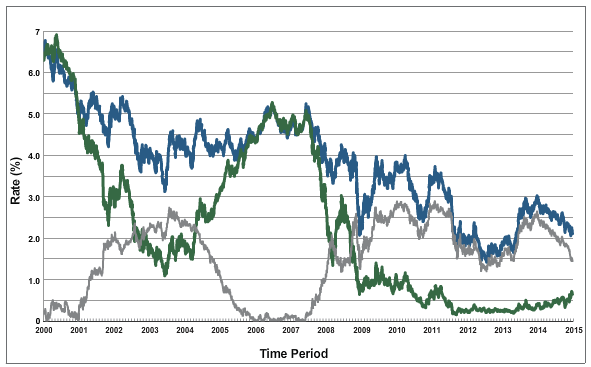
1.) Federal Government: This graph shows what has happened to interest rates on two and ten year Treasuries since 2000 and the difference between the two since then:
Back in January 2000, the average interest rate on the marketable and non-marketable debt of the federal government was 6.537 percent. In November 2014, this had dropped to 2.38 percent. On every trillion dollars of debt, the federal government saves $10 billion in interest payments for every 1 percent drop in interest rates every year. The drop in average interest rates on the debt from 2000 to 2014 $41.57 billion for every trillion dollars of debt every year. With the current $18.14 trillion in debt, this year, the current low interest rates have reduced interest payments by $754 billion compared to what the interest expense would have been with rates comparable to those in the early 2000s.
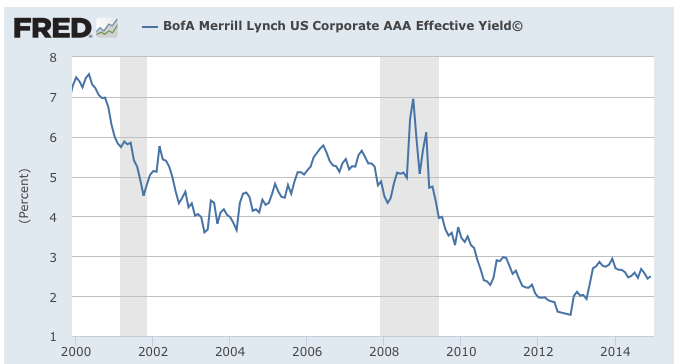
2.) Corporate America: Here is a graph showing the interest rates on AAA-rated corporate bonds since 2000:
Over the 15 years, interest rates have dropped from a peak of 7.57 percent in May 2000 to 2.5 percent in December 2014.
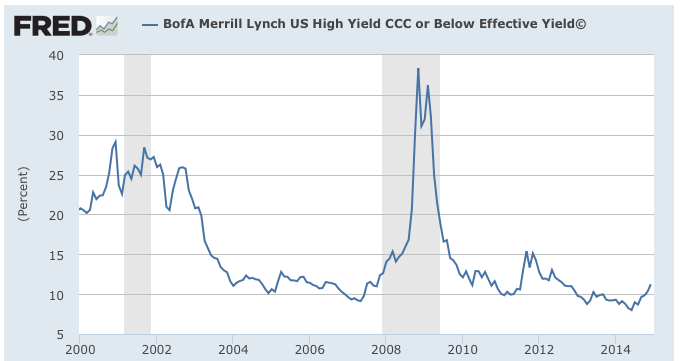
Here is a graph showing the interest rates on CCC-rated (or below) corporate bonds since 2000:
Excluding the extraordinary period during the Great Recession, interest rates on corporate junk bonds has fallen from 29.09 percent in December 2000 to 11.24 percent in December 2014. If we include the Great Recession, in November 2008, the yield on corporate junk rose to a high of 38.34 percent.
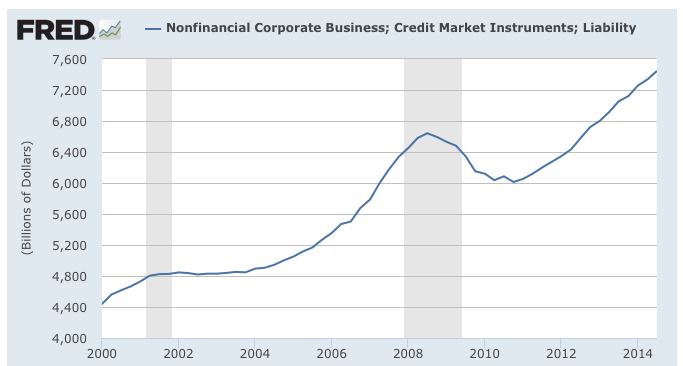
Partly as a result of ultra-low interest rates on corporate debt, here's what has happened to corporate debt levels since 2000:
Corporate debt has grown from $6.012 trillion in the fourth quarter of 2010 to its current level of $7.447 trillion, an increase of $1.435 trillion or 23.9 percent in just four years.
The policies of Mr. Bernanke and Ms. Yellen have provided a very significant benefit to the federal government and Corporate America at the expense of the nation's savers. With interest rates hovering at multi-generational lows for the past five years, there is very little incentive for Americans to save money for the future. Recent research from the FDIC and the Federal Reserve shows that 7.7 percent of American households do not even have a bank account and 57.9 percent of households have insufficient savings to cover three months of expenses. The recent increases in the stock and real estate markets resulted in an improving "wealth effect" for some households but, as we recall from 2008 – 2009, such an effect can disappear overnight.
Click HERE to read more of Glen Asher's columns
You can publish this article on your website as long as you provide a link back to this page.



Be the first to comment