The kerfuffle over Europe's sovereign debt levels has died down to the point where it barely makes the pages, virtual or otherwise, of the mainstream media. Unfortunately, as you will see, the problem has not gone away despite the imposition of much hated austerity measures.
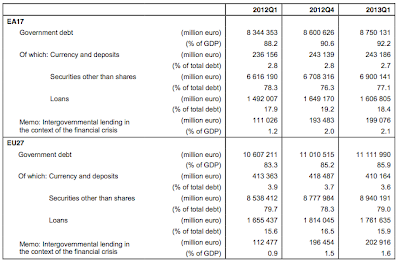
Figures from Eurostat show that at the end of the first quarter of 2013, the government debt-to-GDP ratio in the euro area (the 17 nations that are using the euro as their currency or EA17) stood at 92.2 percent compared to 90.6 percent one quarter earlier. In the EU27 (the broader Europe), the ratio rose from 85l2 percent to 85.9 percent from the last quarter of 2012 to the first quarter of 2013. If we look back one full year, the EA17 debt-to-GDP level rose from 88.2 percent to its current 92.2 percent and the EU27 debt ratio rose from 83.3 percent to 85.9 percent. This cannot be termed as "healthy" in any way and seems to be heading in the wrong direction.
Here is a chart showing the overall government debt in euros, debt-to-GDP ratio and the composition of the debt for both the EA17 and EU27:
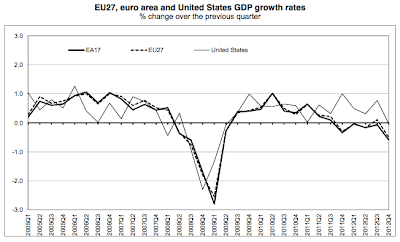
The total government debt for the EA17 is a massive 8.750 trillion euros, equivalent to $11.55 trillion (U.S.). The debt grew by 406 billion or 4.9 percent in just one year, well above the overall "growth" rate of the economy which actually contracted by 0.9 percent on a year-over-year basis from the fourth quarter of 2011 to the fourth quarter of 2012 as shown here:
My, doesn't that look unhealthy!
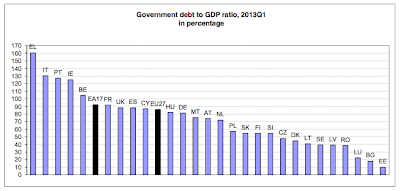
Here is a bar graph showing which European Member States are the worst debt offenders:
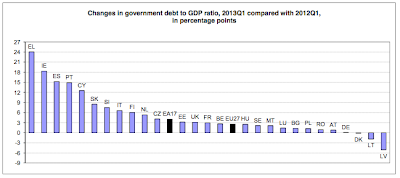
Of all 27 Member States, 24 saw their debt-to-GDP levels rise on a year-over-year basis with the worst of the worst being:
Greece – plus 24.1 percentage points
Ireland – plus 18.3 percentage points
Spain – plus 15.2 percentage points
Portugal – plus 14.9 percentage points
The three Member States that saw their debt-to-GDP levels shrink were:
Latvia – minus 5.1 percentage points
Lithuania – minus 1.9 percentage points
Denmark – minus 0.2 percentage points
Here is a bar graph summarizing the changes in government debt ratio levels from the first quarter of 2012 to the first quarter of 2013:
While Europe's debt crisis appears at first glance to be on the back burner, the recent data from Eurostat suggests that it could soon be 2010, 2011 and 2012 all over again. It also suggests that the massive intervention from central banks across the Eurozone bought little more than a time delay. As economists have noted, the current ultra-low interest rate environment brought to us by a central banker near us has accomplished two things:
1.) Allowed governments to spend more than is prudent.
2.) Allowed governments to acquire more debt than is prudent.
The day of reckoning for Europe looms large.
Click HERE to read more of Glen Asher's columns
You can publish this article on your website as long as you provide a link back to this page.


Be the first to comment