I stumbled across this very interesting presentation/speech while surfing the internet. The presentation, entitled "The Sovereign Crisis: When Debt is No Longer Risk Free", was written by Lawrence Goodman, President of the Center For Financial Stability. The most interesting section of the presentation was Mr. Goodman’s examination of the role of United States Treasury debt in the current and seemingly endless global debt crisis.
Mr. Goodman notes that the role of the United States dollar as the world’s first choice for its reserve currency is changing. As I posted here, China is the world’s largest holder of United States Treasury securities, holding a total of $1.1595 trillion worth at the end of January 2012 according to the U.S. Treasury Department. This is definitely a massive holding, however, it is down from its peak of $1.3149 trillion just 7 months earlier, a drop of $155.4 billion or 11.8 percent. In fact, Japan who was the largest holder of U.S. Treasuries until September 2008, now holds $1.079 trillion worth of Treasuries, just $80.5 billion less than China, down substantially from a difference of $425.4 billion in June 2011. Looking on a year-over-year basis, China’s holdings of Treasuries have remained more or less stable with a minute increase of only $4.8 billion (0.4 percent) in the entire year, a growth level that is a far cry smaller than previous years as shown here:
Mr. Goodman notes that the worldwide appetite for U.S. Treasuries is weakening and, that as this demand weakens, it will make it increasingly difficult for the federal government to fund its seemingly endless deficits. This graph shows how the cumulative deficits as a percentage of GDP incurred by the federal government during the period from 2008 to 2011, as a response to the Great Recession, grew at a rate that was far higher than the recession in 1982 or even the Great Depression:
Within a three year period, the cumulative deficit in response to the Great Recession in the period from 2008 to 2011 reached 35 percent of GDP. It took nearly 9 years for the cumulative deficit to reach 35 percent of GDP in response to the 1982 Recession and 10 years for the cumulative deficit to reach 30 percent of GDP in response to the Great Depression. This data tells us that Washington is spending far more money in a far shorter period of time; money that they don’t have, requiring the amassing of even greater debt and requiring the co-operation of the world’s bond purchasers.
Washington has grown most accustomed to having the world’s bond markets swallow whole every bit of debt that they issue, largely because the world has regarded the United States dollar as its reserve currency. This has allowed the United States to amass levels of debt (currently $15.620 trillion) that would be unserviceable by most other nations, save Japan, a country whose citizens own most of its debt, unlike the United States.
Here is a graph showing the amount of the United States debt maturing in the next year as a percentage of GDP:
You can quite quickly see that the rollover of maturing debt is just below its all-time high reached just after the Great Recession and is well above the 1973 to 2007 average of just under 10 percent of GDP. While the amount of debt maturing is not critical at this juncture, this is one of the problems facing the world’s third largest nominal debtor nation, Italy. In 2012 alone, Italy has nearly €340 billion worth of its debt maturing, nearly the size of the entire Greek debt problem. Countries become vulnerable to their debt issues at maturity because re-funding the debt leaves governments at the mercy of whatever interest rates are prevailing at the time of maturity. This is very similar to the issue facing mortgage holders when their term is up and they have to roll-over their mortgage debt at a new and possibly higher interest rate.
The United States will be facing this problem over and over again in the coming years. As shown in this graph, the government debt profile was far different in 1946 than it was in 2010:
Just after the Second World War, over 35 percent of the total federal debt had maturities longer than 10 years; by 2010, that had dropped to 10 percent. In 1946, approximately 10 percent of the total federal debt had maturities of between one and five years; by 2010, that had risen to nearly 40 percent of the total. The current maturity profile is very risky because it makes the government very, very susceptible to a period of higher interest rates; it is best compared to a saver who, rather than laddering their fixed income profile, chooses to have most of them mature over a very short time frame. In both cases, the risk is greatly elevated.
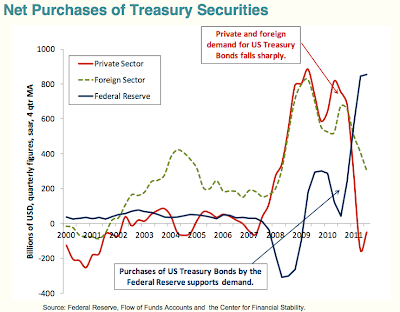
As I noted at the beginning of this posting, conventional wisdom has us believing that the demand for United States Treasury obligations will be endless. Such is not the case as we saw in the example of the changes in China’s purchasing habits. This graph shows the drop in both private (red line) and foreign (green line) demand for United States Treasury Bonds since 2011:
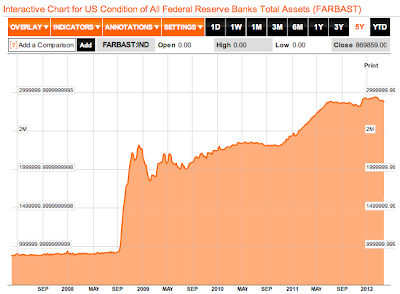
Offsetting the drop in demand by private and foreign entities is, drum roll please, everybody’s friend, the Federal Reserve as shown on the blue line. This is, in large part, why the Federal Reserve’s balance sheet has done this:
Our pals at the Fed are single-handedly controlling the Treasury Bond market. The actions (QE 1 and 2 and "The Twist") by the Fed are highly distortionary, pushing bond prices to artificial highs and yields to artificial lows as shown on this graph of 10 year Treasury Bonds:
The rather desperate steps taken by the Federal Reserve to stimulate the American economy back to life have resulted in an artificial market for United States federal debt. Rather than reflecting the reality and risks of an ever-growing $15.6 trillion debt, bond markets are reflecting the seemingly endless purchases of Treasuries by the Federal Reserve. This has prevented market forces from taking hold, lulling Washington into a false sense of debt security. As I’ve posted previously, the average interest rates on the federal debt were at an all-time low of 2.306 percent in 2011, well below their peak of 6.639 percent in 2000 and their 12 year average of 4.539 percent as shown on this chart:
Not only should we be thanking Mr. Bernanke for missing the housing crisis and dumping record amounts of "cash" into the economy, eventually, we may owe him a debt of gratitude for lulling Washington into inaction on the pending federal debt crisis. Way to go Mr. B. You did it again!
Click HERE to read more of Glen Asher’s columns.
Article viewed on Oye! Times at www.oyetimes.com
You can publish this article on your website as long as you provide a link back to this page.


Be the first to comment