
 During the third quarter of 2011, the Brookings Institute released its most recent MetroMonitor which tracks the recession and recovery in the 100 largest metropolitan areas in the United States. Here are some of the highlights. Please note that the economic indicators are current to the end of the second quarter of 2011 except where I note otherwise.
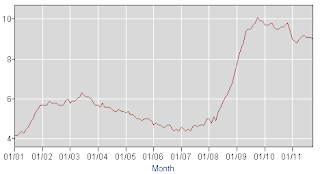
The report opens by noting that various economic indicators show that the American economy has stalled. The national unemployment rate remains at an elevated rate of 9.0 percent, especially when one considers that this is supposed to be the second year of a so-called “recovery”. Here is a graph showing how elevated the unemployment rate is compared to rates over the past 10 years showing just how America’s employment situation has not improved meaningfully since early 2009:
According to the Bureau of Labor Statistics (BLS), state jobless rates in 40 states were down on a year-over-year basis but the number of unemployed (seasonally adjusted) actually experienced a statistically significant increase in 23 states as shown in this chart:
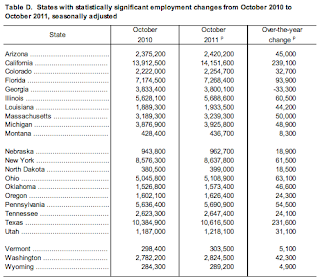
Note that only one state, Georgia, had a statistically significant year-over-year increase in the number of employed. Pretty sad, isn’t it?
As well, house prices, construction and sales remain very weak and wages are lower than they were last year at this time. All of this does not particularly bode well for Americans, particularly as it certainly appears that another recession is just around the corner. Now, let’s go back to the findings of the MetroMonitor and focus on how the economic recovery is impacting life in metropolitan regions of the United States.
Here is a chart showing which 20 metropolitan areas are performing well and which 20 are performing poorly:

Here is a map showing the strongest 20 metropolitan areas in dark blue dots and the weakest in dark orange dots ranked on a combination of four factors including changes in the unemployment rate from June 2008 to June 2011, percentage change in gross metropolitan product, percentage change in the housing index and the percentage change in jobs (the last three factors are measured by comparing data from June 2011 to the peak quarter):

Notice the concentration of orange dots in the sunbelt areas (generally) and the concentration of dark blue dots in the northeast states, the Great Lakes area (excluding the automotive manufacturing centres) and the Texas/Oklahoma oil producing regions.
You will notice that most of the metropolitan areas that suffered the least since 2008 have economies that rely on either government (i.e. Washington, D.C. and other state capitals), education (i.e. Boston) or the energy industry (i.e. Dallas, Houston, Oklahoma City). I guess that high oil prices really did benefit some parts of America! The metropolitan areas that continue to suffer the most are those related to automobile manufacturing (i.e. Detroit) or those that suffered a large magnitude housing market bust (i.e. Las Vegas, Phoenix, and most of California and Florida). Most of the strongest performing metropolitan areas saw an increase in government employment, the exact opposite scenario to what was experienced in the weakest metropolitan areas which saw a loss of government jobs.
Now let’s look at how well the nation’s metropolitan areas are recovering. Here is a chart showing the strongest 20 recovering metropolitan areas and the weakest 20 recovering metropolitan areas:

Here is a map showing the same data:

The strongest recovery is clearly noted in Texas and its neighbouring oil-rich states. As well, the states around the Great Lakes are recovering well with the recent increases in the production of both automobiles and durable goods. That said, the economic performance of many of these manufacturing centres is still well below what it was prior to the Great Contraction. The recent resurgence in the technology sector has been kind to metropolitan areas including Boston, Worcester, Portland, Rochester, Hartford and San Jose.
The weakest recovery is noted in areas where real estate was hardest hit, most particularly, the parts of America that get the warmest temperatures and the most sun. It was these areas that experienced a massive upward and equally massive downward swing in housing prices.
Now let’s take a more detailed look at the unemployment statistics for America’s metropolitan areas. The Bureau of Labor Statistics breaks down the United States into 372 metropolitan areas. The unemployment data for September 2011 shows that 228 metropolitan areas have unemployment rates that are lower than the national average of 9.0 percent and 144 metropolitan areas that have unemployment rates that are higher than the national average. In fact, there are 48 metropolitan areas that have U3 unemployment rates that are in excess of 11 percent as shown here:
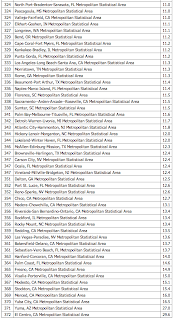
September data from BLS shows that 84 metropolitan areas (or 22.5 percent of the total) had unemployment rates in excess of 10 percent, down from 106 areas one year earlier. California had the distinct honor of having five areas with unemployment rates of at least 15 percent. Of the 49 metropolitan areas with a population of 1 million or more, Las Vegas has the highest unemployment rate of 13.6 percent. The good news is that the September 2010 unemployment rate in Las Vegas was a breath-taking 15.6 percent so, perhaps there is a very, very dim glimmer of hope.
To put all of this data into perspective, employment has rebounded from its Great Recession low point in 92 of the 100 largest metropolitan areas by the second quarter of 2011, however, only 16 gained back more than half of the jobs that they lost between their pre-recessionary peak and their post-recessionary low point and only four (El Paso, McAllen, Austin and San Antonio) made a complete recovery by the second quarter of 2011. Unfortunately, eight metropolitan areas had not recovered any of the jobs that they had lost since their employment peak; Augusta, Colorado Springs, Des Moines, Kansas City, Lakeland, Palm Bay, Richmond and Riverside are the unfortunate communities where employment still lags.
Lastly, let’s take a brief look at housing prices in America’s major metropolitan areas. Here’s a screen capture showing the changes in the Federal Housing Finance Agency’s House Price Indices for the top 50 metropolitan areas in the United States for the second quarter of 2011:
Notice that only 24 out of all 308 metropolitan areas have year-over-year house price increases, most of them well less than 1 percent.
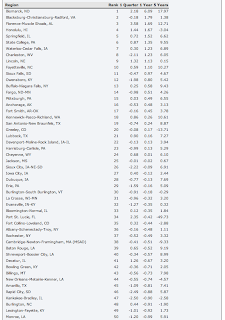
Now here are the bottom 50 metropolitan areas with the largest year-over-year price decreases (middle column of data):
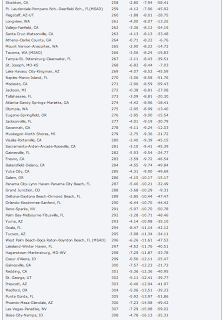
Notice that many of the sunnier climes are still suffering from year-over-year house price decreases in excess of 10 percent and most recent quarterly price declines in excess of 7 percent. This shows us that the real estate market is far from turning around, likely due to a hefty oversupply of foreclosures. Over a five year period, there are 11 metropolitan areas with price decreases in excess of 50 percent, mainly in Florida, California (Merced at a stunning -63.99 percent!) and Nevada.
When you assimilate all of this data, it becomes quite clear that, unfortunately, for those who live in Metropolitan America, the Great Recession is far from over. Housing and employment show no signs of returning to their pre-recessionary levels despite massive intervention by the Federal Reserve and massive stimulus by the Obama Administration. The trillions spent have gone somewhere but they certainly have not benefited those who live on the tree-shaded streets of Metropolitan America.
Article Viewed on Oye! Times @ www.oyetimes.com
To view all Glen Asher Blogs Click HERE
You can publish this article on your website as long as you provide a link back to this page.

Be the first to comment