With the new Federal Reserve Chairperson set to take the golden throne, there has been quite a bit of tongue wagging about the end of the Fed's seemingly endless program of shoving money down the economy's throat. Obviously, tapering will have repercussions that will echo through the world's economy and thanks to the IMF's latest Global Financial Stability Report, we have an idea of how costly the end of QE will be.
The authors of the report begin by noting that the interest rate increases since the spring of 2013 have provided a "mini stress test" that has shown where the economy is fragile. As shown here, the value of bonds over the past year has been quite volatile, dropping over the period from June to the end of September 2013 as rumours of tapering took hold in the world's bond markets:
The signalling by the Fed in May that improvements in the economy could prompt a sooner-rather-than-later tapering of its asset purchase program sent chills through the fixed income market which had, for years, been propped up by the seemingly endless ability of America's central bank and its fellow central bankers around the world to print and dump money into the economy. The authors note that "…gradually making the transition to a higher interest rate regime should be positive for financial stability, because risks associated with low rates and the accumulation of financial excesses will be curtailed. This is especially critical given that some of these risks have continued to build, including the deterioration in corporate credit conditions, yield-seeking behaviour among pension funds and insurers and an extension in portfolio duration.". (my bold)
Currently, the IMF projects an orderly rise in interest rates with an average hike of 381 basis points over 49 months with a total hike of 73 basis points in the first year. Looking back at historical interest rate hikes, the projected size of the hike in the first year after the beginning of tapering is about one-third of the average of hikes over all Federal Reserve hiking cycles since 1958 as shown on this chart:
Obviously, it is quite possible that an orderly and relatively small (by historical standards) rate hike may not take place. A sharp and sustained upward move in long-term interest rates could create severe market volatility, particularly if short-term rates rise more quickly, causing heavy losses in portfolios and this could result in forced asset sales which would further depress bond prices and push yields higher. Although the Fed has tools at its disposal to more easily control short-term rate changes, the same cannot be said for its control of long-term rates. This is particularly critical given that in a desperate search for yield, investors dumped trillions of dollars into longer duration bonds of all types as shown on this graph which shows the flow of dollars (trillions) into United States fixed income mutual funds (blue shaded area) versus the flow of dollars into equities (black line):
Note that investments in equities remained relatively constant since 2008 compared to the rapid growth in bond investments over the same time frame. The total global market value of bonds over the last three historical tightening cycles has been $13.319 trillion; in July 2013, the value hit a whopping $41.541 trillion, a 311 percent increase over historic levels. The aggregate value of bonds in the United States over the last three historical tightening cycles has been $5.833 trillion; in July 2013, the value hit $16.065 trillion, again, a massive 275 percent increase over historic levels. These numbers are of great concern since the global bond investment portfolio is now far more vulnerable to changes in interest rates.
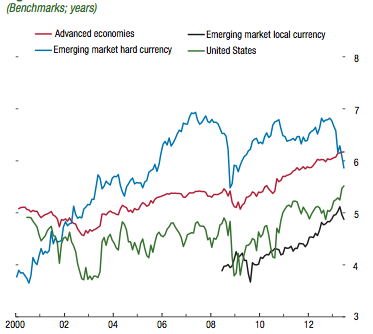
On top of that, the global bond market portfolio duration has lengthened substantially since 2008 as shown on the red line for advanced economies and the green line for the United States where the bond portfolio duration has risen from less than 4 years in early 2008 to its current duration of about 5.5 years in mid-2013:
The increase in duration substantially raises the sensitivity of bond portfolios to rising interest rates. The authors estimate that a 100 basis point rise in interest rates from their current levels will result in a $2.325 trillion loss on global bond portfolios or 5.6 percent of the total value, far more than the losses seen in previous historical tightening episodes. The loss in the aggregate of United States bonds is estimated to be around $876 billion or 5.5 percent of the total value.
Only time will tell whether these prognostications by the IMF are correct, however, it is obvious that central bankers are quite unable to predict the ramifications of ending their long and unprecedented experiment with asset purchases and that the impact of tapering on the economy could be far, far worse than anyone anticipates, plunging the world back into economic crisis mode as the bond bubble bursts.
Click HERE to read more of Glen Asher's columns
You can publish this article on your website as long as you provide a link back to this page.


Be the first to comment