There is a simmering anger in America, an anger that is largely responsible for the election of the current administration in Washington. Millions of American voters feel that they simply cannot get ahead financially no matter how hard they try or what they do. In this posting, I want to look at an interesting metric that may help to explain this growing feeling of disenchantment with the Great American Dream.
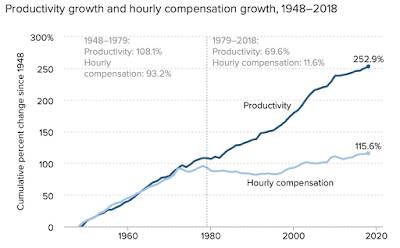
In a recent analysis by the Economic Policy Institute or EPI we find the following graphic:
As you can see on the graphic, when you compare the growth in the average hourly compensation of non-management workers and the growth in net productivity (defined as the growth of output of goods and services minus depreciation per hour worked) you find the following keeping in mind that 1948 is the base year used for comparison:
1.) From 1948 to 1972 – average workers' hourly compensation rose by 92.2 percent and average net productivity rose by 92.2 percent. Over this timeframe, workers' compensation more-or-less rose in tandem with net productivity, in fact, if we look at data during the 1950s and early 1960s, workers' compensation often rose at a faster annual rate than net productivity (i.e 1957 – compensation rose by 37.1 percent compared to a rise of 30.0 percent in net productivity).
2.) In 1966, when compared to 1948, the growth in workers' compensation rose by 64.7 percent compared to a rise of 70.0 percent in productivity, the first year that productivity significantly outstripped growth in workers' compensation.
3.) By the mid-1970s, the growth in workers' compensation was significantly outpaced by productivity when compared to the base year. For example, in 1976, the increase in workers' hourly compensation was 89.4 percent compared to productivity growth of 103.6 percent.
4.) This trend in lower workers' hourly compensation and higher net productivity growth has continued uninterrupted with compensation rising by 115.6 percent and net productivity growing by 252.9 percent when compared to the base year of 1948.
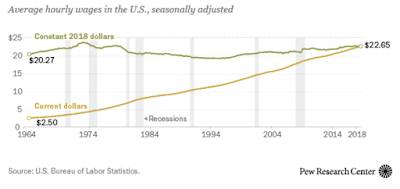
While this situation is bad enough, research by the Pew Research Center shows that, while American wages have risen over the past 40 years, when measured against price increases (i.e. in real terms), the purchasing power of America's working class has barely moved over the past four decades as shown here:
The economic stagnation experienced by Main Street America, particularly those who reside in the middle class, is clearly driving American voters into a search for political change. It is the driving force behind the political right's longing for the America of the 1950s and 1960s when American workers were actually paid fairly for their productivity and the political left's moves toward implementation of the "nanny state" that uses socialist programs to answer the question of wages that are too low to get ahead.
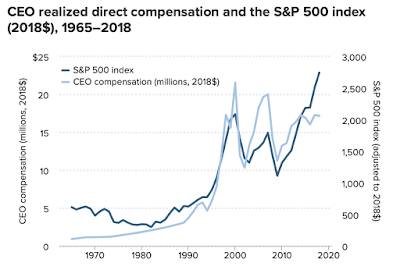
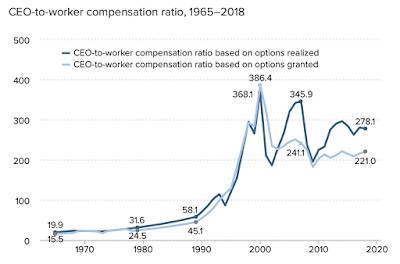
Let's close with one final thought. Just in case you thought that American workers were all in the same boat, these two graphics will clearly show you that a certain working Americans have benefitted significantly over the past four decades:
God bless America…well, at least a subset of America.
Click HERE to read more from this author.
You can publish this article on your website as long as you provide a link back to this page.


Be the first to comment