
Over the past two or three weeks, there has been a marked change in how the mainstream media, particularly in the United States, is reporting data from the COVID-19 pandemic. In this posting, I hope that I can supply my readers with some perspective to help them better understand what they are seeing and put what they hear and read into context.
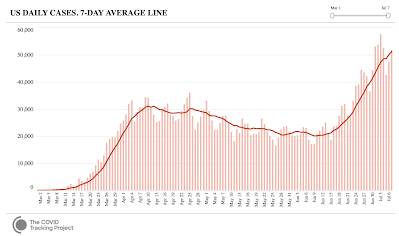
Let's start with this graphic from the COVID Tracking Project which shows the number of new positive cases of COVID-19 on a daily basis:
That looks very alarming, doesn't it? The number of new daily cases has risen from a 7-day average of around 21,000 at the beginning of June to its current level of 57,000 in early July (noting that the data isn't complete for the past few days). That's nearly triple the number of COVID-19 cases over a one month period.
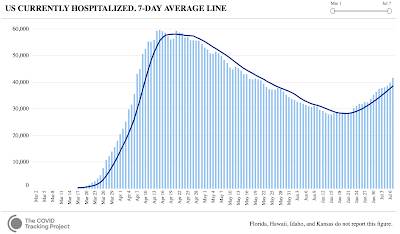
Now, let's look this graphic which shows the number of total hospitalizations for COVID-19 in the United States on a daily basis:
The daily number of COVID-19-related hospitalizations peaked at 59,539 on April 15, 2020, fell to a low of 27,778 on June 15, 2020 and has since risen to its current level of 41,700 on July 7, 2020.
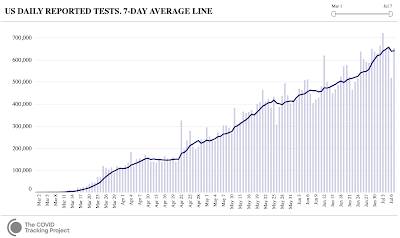
Please remember that we have to put this "alarming data" into context. Part of the recent growth of these two metrics can be explained by this graphic which shows the 7-day average of reported COVID-19 tests:
Over the period from June 1 to July 1, the number of daily COVID-19 tests administered has risen from 419,566 to 627,225, an increase of 49.5 percent.
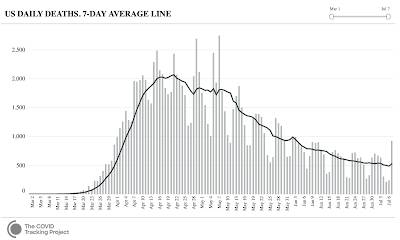
Lastly, let's look at this graphic which shows the 7-day average number of daily COVID-19-related deaths:
While the number of deaths on July 7, 2020 looks rather alarming, in fact, the 7-day average number of daily COVID-19-related deaths has fallen from roughly 2000 in April to between 500 and 600 in late June and early July, a drop of roughly 75 percent.
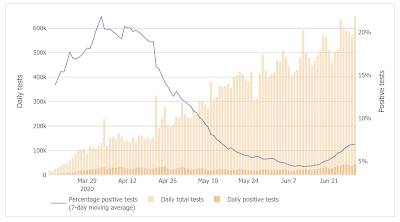
Let's close this posting. The most important thing to remember during this "unprecedented" health emergency is that all data must be put into context. While the alarmist mainstream media is touting the growth in the number of new COVID-19 positive tests as a sign that "we are all about to die", in fact, the increased number of COVID-19 positive tests can be explained, in part, by the growing number of daily tests administered to Americans as we can see on this graphic which shows the percentage of COVID-19 positive tests against the number of tests being administered:
What should be even more encouraging to all of us is the fact that the number of daily deaths and hospitalizations from COVID-19 are at extremely low levels compared to the peak of the pandemic in April 2020, exactly what would be expected as the virus retreats.
But you'll never hear that from the "talking heads".
Click HERE to read more from this author.
You can publish this article on your website as long as you provide a link back to this page.

Be the first to comment