
This article was last updated on May 19, 2022
Canada: ![]() Oye! Times readers Get FREE $30 to spend on Amazon, Walmart…
Oye! Times readers Get FREE $30 to spend on Amazon, Walmart…
USA: ![]() Oye! Times readers Get FREE $30 to spend on Amazon, Walmart…
Oye! Times readers Get FREE $30 to spend on Amazon, Walmart…
 I stumbled on this interesting Economic News Release "Union Members Summary" from the Bureau of Labor Statistics released in January 2011 as part of my research for another posting. In this report, the BLS looks at the status of union membership for 2010 and compares current rates of unionization to past rates as well as examining the rate of unionization among different sectors of workers. Not only is the topic of personal interest, I thought that the topic of unionization was particularly pertinent given the recent actions in Wyoming.
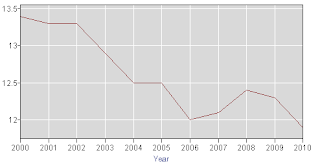
In 2010, the percentage of American workers who were members of a union dropped to 11.9 percent from 12.3 percent a year earlier. Raw numbers show that the number of workers that belonged to unions dropped by 612,000 over the year to 14.7 million. This is down substantially from 17.7 million union workers in 1983, the first year for which comparable data are available and considering the growth in the workforce, the statistics for unions look even worse. In the previous year, the number of union members fell 771,000; much of the decline was due to the loss of hundreds of thousands of jobs in both the manufacturing and construction industries due to the Great Recession.
Here is a graph showing the decline in the percentage of unionized workforce over the past 10 years:
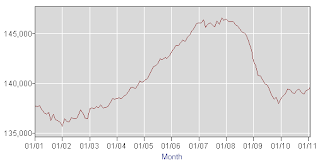
Here’s a graph showing the rise in the number (in thousands) of employed Americans over the past 10 years (including the decline during the recession of 2008 – 2009):
Note that in 2001, there were as few as 136,047,000 individuals in the American workforce. This rose to a peak of 146,584,000 in November of 2007.
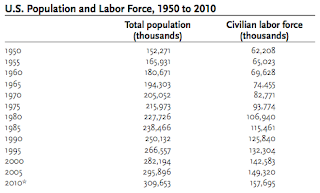
Here is a table from the Population Reference Bureau showing the growing number of workers in the American workforce over the past 60 years:
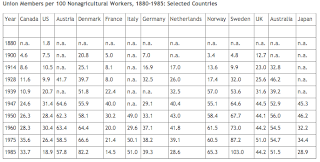
In the United States, the unionization rate rose markedly in the period between the beginning of the Great Depression in 1929 and the advent of the Second World War in 1939. In 1928, 9.9 percent of non-agricultural workers in the United States were unionized. This rose to 20.7 percent in 1939, peaked at 31.4 percent in 1947 and dropped to 26.4 percent by 1975. This is in sharp contrast to many European countries where union memberships have either grown or remained steady at levels that are far higher. Here is a chart showing the penetration of unions into the workforce of other nations from 1880 to 1985:
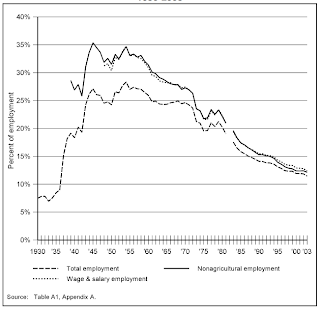
The decline in unionization in the United States really took hold in the 1970s for several reasons. Rising unemployment during 1970s economic stagflation, increased international competition and movement of jobs to the less unionized southern states and rural areas of America undermined the ability of unions to negotiate on behalf of workers. By the 1990s, unionization rates had fallen to the level where unions had little impact on either the working conditions or wages of American workers. Here is a graph showing the changes in the rate of unionization for two sectors of the U.S. economy as well as the entire workforce from 1930 to 2003:
Note how the 2010 unionization rate of 11.9 percent is comparable to the level back in the mid-1930s.
Back to the BLS statistics. The union membership rate for public sector workers is far higher than the membership rate for those employed in the private sector. The rate for public sector workers is 36.2 percent compared to a paltry 6.9 percent for private sector workers. Within the public sector, local government workers led with a 42.3 percent membership rate; this includes occupations such as firemen, police, teachers etcetera. Overall, among occupational groups, education, training and librarians had the highest unionization rate at 34.1 percent. Of the total of 14.7 million unionized labourers in the United States, 7.6 million public sector workers were union members. In the private sector, the lowest unionization rates occurred in agriculture (1.6 percent) and financial activities (2.0 percent). Again, of the total of 14.7 million union members, only 7.1 million of those working in the private sector belonged to a union. When comparing the number of private sector union members to those in the public sector, keep in mind that there are five times more workers in the private sector than in the public sector.
Union membership was slightly more pervasive for men (12.6 percent of the workforce) than for women (11.1 percent of the workforce). This rate has narrowed markedly since 1983 when there was a 10 percentage point difference between the two genders. By age, union membership was highest among workers that were between the ages of 55 and 64 years of age with 15.7 percent of these workers being union members and was lowest among those who were between the ages of 16 and 24 at 4.3 percent.
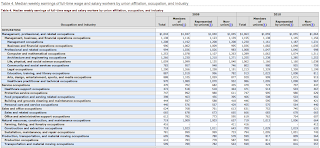
Looking at workers’ earnings, those who belonged to a union had median weekly earnings of $917 compared to $717 for those not represented by unions. Here is a chart showing the median weekly earnings of full-time wage and salary workers, both union and non-union, by occupation comparing 2009 to 2010:
It is interesting to note that the wages for certain occupations vary only slightly based on union membership whereas for others, for example construction, there is nearly a $400 weekly premium for being a union member. Other studies, in particular the Cornell University publication "Union Membership Trends in the United States" have noted that the wage premium for union members is generally greater for less-skilled, less-educated occupations and that premiums have been falling from 21 to 23 percent in the 1970s to 14 percent by the years 2000 – 2001.
Union membership varies widely by state. In 2010, the largest number of union members reside in California with 2.4 million union members and New York with 2.0 million union members. Nearly half of the total 14.7 million members in the United States live in six states; California, New York, Illinois, Pennsylvania, Ohio and New Jersey. Despite the fact that Texas has 1.9 million more wage and salary employees than New York, it had about one-quarter of the number of union members.
One industry that has been particularly hard-hit by the decline in unionization is the automotive industry. The former bastions of the United Auto Workers (UAW) have seen their heartland decimated by plant closings between 1999 and 2009; Michigan’s motor vehicle and parts manufacturing declined by 72 percent, Ohio’s declined by 58 percent, Indiana’s by 48 percent and the overall nation saw a drop motor vehicle industrial activity of 50 percent.
Theories regarding the impact of unionization and de-unionization of the United States are almost as numerous as economists. Some studies show that the wage premium causes lower profitability for employers and that this can result in lowered capital investment. This is particularly critical during economic downturns when profits are under pressure and there is a large pool of unemployed workers to choose from when replacing workers. Effects of unionization on productivity is also not conclusive; some studies conclude that productivity is higher in certain industries where unionization is pervasive and others conclude that restrictive work rules negatively impact the ability of management to reassign employees or implement new technologies. During the Great Recession, it appears that one of the most highly unionized occupations was the hardest hit by layoffs. The construction industry accounts for more than 10 percent of union members in the private sector, yet, it saw a drop in union membership from 14.5 percent in 2009 to 13.1 percent in 2010, particularly hard-hit was the non-residential construction sector. Is it possible that the job cuts (and resulting drop in union membership) were deeper than they would ordinarily have been because of the union wage premium?
It is interesting to observe the massive changes in the American workforce over the past three decades. Not only has the impact of unions diminished, hand-in-hand with weakened unions we see that real median wages have increased only marginally over the same time period. With the jobless "recovery" after the Great Recession, it will be interesting to see how long it takes before America’s unions regain their power, most particularly in the private sector. With looming cost-cutting measures anticipated as part of deficit reduction, the negative effect on government employment at all levels may result in unions never recovering to the glory days of the 1950s and 1960s.
Click HERE to read more of Glen Asher’s columns.
Article viewed at: Oye! Times at www.oyetimes.com
You can publish this article on your website as long as you provide a link back to this page.

Be the first to comment