There has been substantial discussion about raising the minimum wage in America over the past year. Even President Obama got in on the action in November 2013, backing a bill that was sponsored by Senator Tom Harkin (D-Iowa) and Representative George Miller (D-California) that would push the federal minimum wage up from its current level of $7.25 an hour to $10.10 an hour in 95 cent an hour increments. Let's look at some statistics from the Bureau of Labor Statistics that gives us a sense of how many American workers would benefit from any proposed changes.
Historically, the concept of a minimum wage came into being during the later part of the Great Depression. During the Great Depression, crushing unemployment in the United States made millions of Americans so desperate for work that they would work for any wage under any conditions. In 1938, Congress passed the Fair Labor Standards Act of 1938 which set the standard for minimum wages that every employer had to pay to each of their employees. Back then, the minimum wage was set at $0.25 an hour and as shown on this graph (in blue) which also shows the real value of the minimum wage corrected for inflation (in red), the federal mandated minimum wage has a very long history of changing at irregular intervals:
You can readily see that the current real minimum wage is now below the levels seen back in the late 1950s. The graph above shows a decline in the real value of the minimum hourly wage when Congress elects not to raise the level to keep pace with inflation.
According to the 2007 iteration of this Act, the minimum wage was scheduled to rise as follows:
1.) $5.85 an hour beginning on the 60th day after May 25, 2007
2.) $6.55 an hour beginning 12 months after that 60th day
3.) $7.25 an hour beginning 24 months after that 60th day
Basically, the federally mandated minimum wage has not risen since 2009, nearly four and a half years ago.
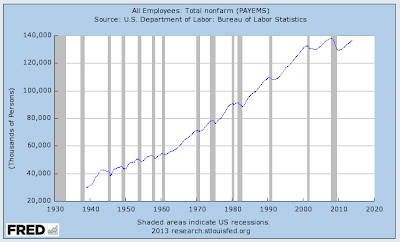
Now, let's look at some statistics. Here is a graph showing the total number of non-farm employees in the United States:
In November 2013, there were 136.765 million non-farm workers across America. This statistic will help us put the number of Americans earning at or below the federally mandated minimum wage level into perspective.
Here are some statistics for 2012 giving us a sense of how many American workers are earning at or below the prevailing minimum wage (MW):
Workers 16 years and older at MW: 3.550 million
Workers 16 years and older at less than MW: 1.984 million
Workers 25 years and older earning MW: 704,000
Workers 25 years and older at less than MW: 1.049 million
Full-time workers earning MW: 501,000
Full-time workers earning less than MW: 760,000
Part-time workers earning MW: 1.063 million
Part-time workers earning less than MW: 1.223 million
In total, 4.7 percent of American workers are earning at or below the minimum wage level with 2.1 percent at minimum wage and 2.6 percent below minimum wage. By the time one reaches the age of 25, 2.9 percent of American workers are still earning at or below minimum wage. Apparently, its not just teenagers that are earning little.
Here is a look at the total number of workers at or below minimum wage by region:
Northeast: 648,000
Midwest: 808,000
South:1.674 million
West: 420,000
Here is a state-by-state chart showing the number and percentage of workers that are at or below the minimum wage level:
Overall, Idaho has the highest percentage of workers at or below the minimum wage level at 7.7 percent followed by Texas at 7.5 percent, well above the national level of 4.7 percent. Alaska has the lowest percentage of workers at or below the minimum wage level at only 1.0 percent followed by Oregon at 1.1 percent.
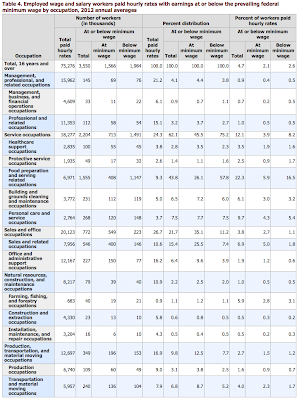
Here is a chart showing the relationship between occupations and minimum wage:
Overall, those working in service occupations are most likely to earn at or below the minimum wage level with a substantial 22.3 percent of workers in food preparation and serving occupations suffering from very low wages followed by 9.7 percent of workers in personal care and service occupations. Think of that the next time that you are getting your hair cut by someone with very sharp scissors or you decide to complain about restaurant service!
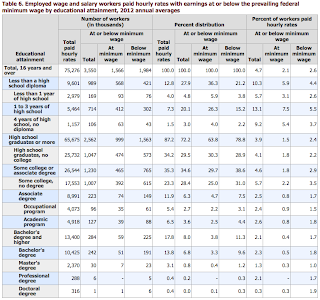
Lastly, here is a chart showing the relationship between educational level and minimum wage:
A substantial 13.1 percent of workers with only one to three years of high school earn at or below the minimum wage level followed by 9.2 percent of workers with four years of high school and no diploma. As educational levels rise, there are fewer workers earning at or below the minimum wage level; by the time a worker gets an occupational college degree, only 2.4 percent are at or below minimum wage and only 1.3 percent of workers with a Master's degree are at or below minimum wage.
Obviously, the concept of raising minimum wage is a contentious one. Some economists feel that raising the minimum wage would result in job slashing and cuts in the number of jobs available for lower-skilled workers. That said, a panel of nearly 40 well respected economists surveyed by the University of Chicago's Booth School of Business in early 2013 were pretty evenly split on the question of whether raising the federal minimum wage to $9 an hour would "make it harder for low-skilled workers to find employment" as shown on these two graphs:
Obviously, economists regard this issue as very complex. That said, nearly half (47 percent) of the economists agreed or strongly agreed that the distortionary costs of raising and indexing the federal minimum wage to inflation were sufficiently small compared to the benefits that would accrue to low-skilled workers.
This issue is extremely complex and the solution is not simple. However, if one compares the stalled real wages of minimum wage earners over the past decades to those dwelling in corner offices, the unfairness of the current working environment in America becomes quite apparent.
Click HERE to read more of Glen Asher's columns
You can publish this article on your website as long as you provide a link back to this page.


Be the first to comment