In the early days of my career in the late 1970s and early 1980s, one thing that employees could count on was getting a raise that would include a cost of living allowance or COLA. That way, we had some assurance that our compensation was keeping up with increases in what we were spending to live. A paper by Lawrence Mishel and Kar-Fai Gee gives us some insight into the conundrum that faces workers in America. While labour productivity increased over the four decades from 1973 to 2011, the same cannot be said for gains in real wages, that is, wages that are corrected for increases in the cost of living.
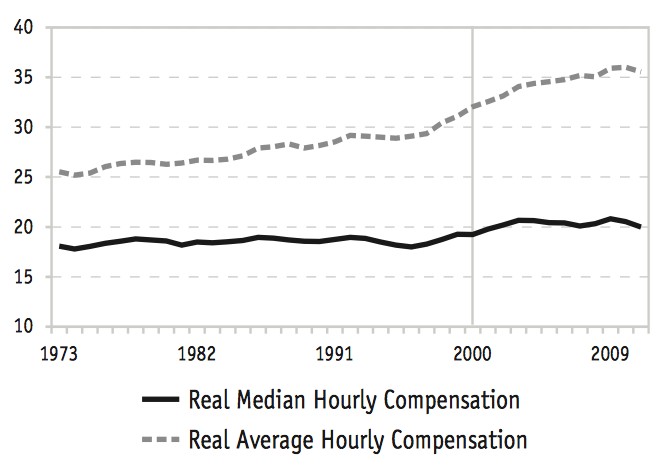
The median wage represents the wage earned by a worker at the midpoint between the highest and lowest paid worker. Using median values rather than average values avoids the problem that can occur when wages change only at the top and bottom of the distribution. Over the period from 1973 to 2011, the long-term growth in the median real compensation, which includes all benefits plus salary and wages, has been very low, averaging only 4 percent over the four decades as shown on this graph:
Over the period, the median hourly compensation has risen from $18.08 (in 2011 dollars) in 1973 to $20.01 in 2011, an average annual increase of 0.27 percent per year. The graph shows that the real median compensation level was pretty stagnant from 1973 to 1992 when it increased rather sharply until 2003 and then remained stagnant thereafter. In fact, in 2011, the real median compensation fell by 2.5 percent; this in a year when the economy was in full recovery mode!
Now, let's compare what happened to the average and median real hourly compensation, again, keeping in mind that average compensation is affected by changes in compensation at the top and bottom of the entire distribution (i.e. if wages increase at the top, the average will increase but most workers may still have seen little increase in compensation):
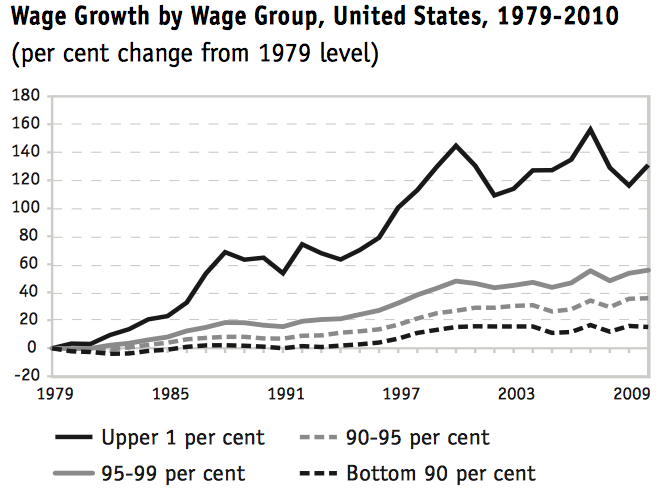
Real average compensation has risen from $25.54 (in 2011 dollars) in 1973 to $35.05 in 2011 which results in an annual growth rate of 0.87 percent, just over three times the growth rate of the median. The faster growth in the average means that earning inequality is growing and that the highest paid workers are seeing their compensation rise at rates much higher than among their lesser paid peers as you can see on this graph:
The share of all wages paid to the top one percent of earners has nearly doubled from 1973 to 2010; in 1973, the top earners received 6.8 percent of all wages paid. By 2010, this had increased to 12.9 percent of all wages paid. In fact, the top 0.1 percent of earners received 4.7 percent of all wages paid in 2010, up from 1.5 percent in 1979. This is in sharp contrast to the earnings of the bottom 90 percent of earners who saw their wages in 2010 being only 115 percent of their wages way back in 1979!
Now, let's switch gears for a minute. Let's look at how productive America's workers have been. Labour productivity is defined as the output produced on an hourly basis by an average worker and is measured as real GDP per hour worked as shown on this graph:
Between the first quarter of 1973 and the first quarter of 2011, real output per hour rose from 51.26 to 104.03, an increase of 102.9 percent. In real dollar terms, labour productivity grew from $33.68 (in 2011 dollars) in 1973 to $60.77 in 2011, an average increase of 1.56 percent per year. The real growth rate in worker productivity is 5.8 times the growth rate in median real hourly compensation!
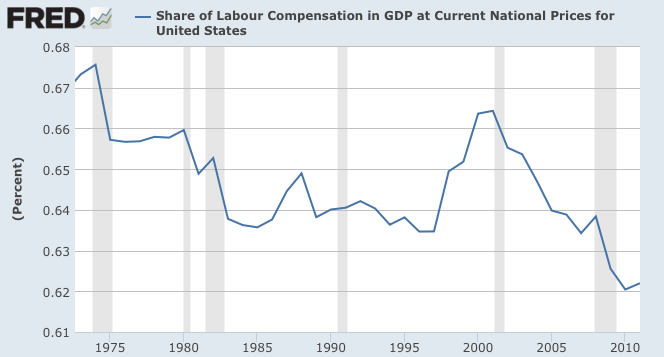
Here is a graph showing the labour share which is defined as the share of total nominal worker compensation in nominal GDP:
Between 1974 and 2011, labour's share of GDP fell from 67.7 percent to 62.2 percent, the lowest level on record looking back to 1950. Note that during the 1980s and early 1990s, labour's share was pretty consistent, rising between 1997 and 2001 when it hit 66.4 percent. From there, it began its downhill slide to 62.2 percent as noted above.
What does all of this mean? It means that, on average, workers in America have benefitted very, very little from growth in labour productivity (for which they are largely responsible) in terms of real wage growth and that their share of the economy has declined to levels not seen going back six decades. Sadly, this is a situation that has become worse over time. The gap between median wage and productivity growth was 0.84 percentage points per year between 1995 and has increased to 1.84 percentage points per year between 2000 and 2011. There has been a dramatic increase of redistribution of income from labour to capital as a share of America's total income, largely related to these factors:
1.) de-unionization.
2.) globalization.
3.) high trade deficits.
4.) high unemployment.
5.) higher levels of investment in short-lived capital assets including information and communication technologies that require frequent updating and replacement.
The sluggish increase in the level of real median worker compensation and the contrasting substantial increase in worker productivity speaks to the "new way of doing business in America". As the Great Recession showed, workers are deemed necessary only because they are critical to increasing output and are quickly ushered to the door when times get tough.
Click HERE to read more of Glen Asher's columns
You can publish this article on your website as long as you provide a link back to this page.


Be the first to comment