This article was last updated on April 16, 2022
Canada: ![]() Oye! Times readers Get FREE $30 to spend on Amazon, Walmart…
Oye! Times readers Get FREE $30 to spend on Amazon, Walmart…
USA: ![]() Oye! Times readers Get FREE $30 to spend on Amazon, Walmart…
Oye! Times readers Get FREE $30 to spend on Amazon, Walmart…
While the Trump administration has spent considerable energy trying to "fix" its long-term problem with a massive trade deficit as shown on this graphic:
…trade data shows that China is rapidly becoming the world's most important trade partner. Thanks to Visual Capitalist, we have a graphic representation of China's growing importance to global trade and how it is replacing the United States as the nation to trade with.
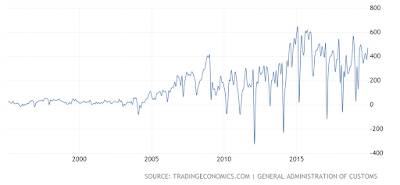
Let's start by looking at some background data. Thanks to Trading Economics, we have this graphic showing China's balance of trade going back to 1981:
In the latest month for which data is available (December 2019), China's trade balance was $46.79 billion, down from $56.80 billion in the same month one year earlier.
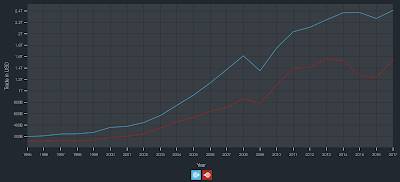
Here is a graphic representation of China's imports (in red) and its exports (in blue) to 2017:
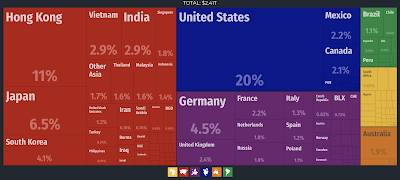
Here are the top destinations for exports from China:
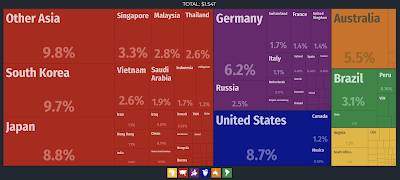
Here are the top nations exporting goods to China:
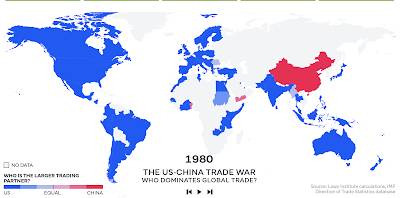
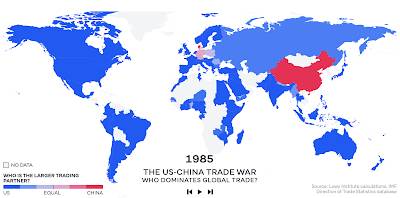
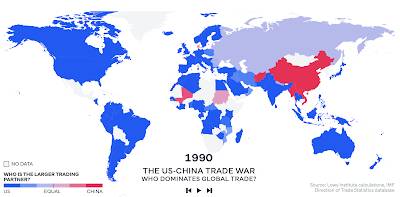
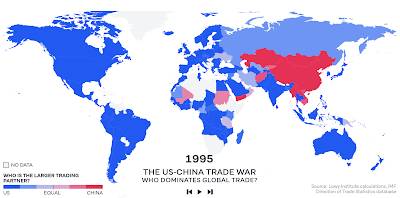
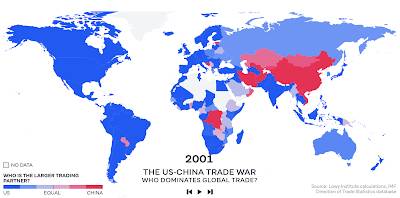
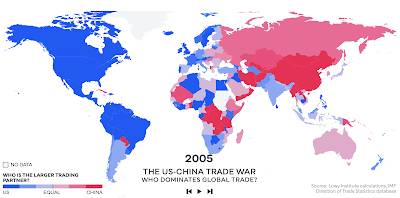
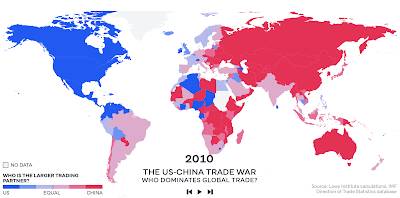
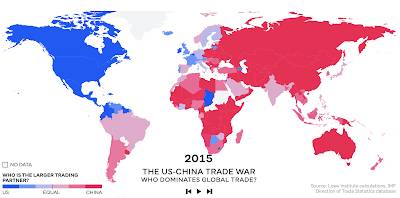
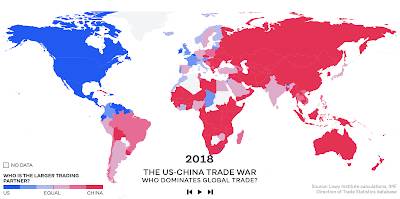
With that background, let's look at how trade with China and the United States, the world's two largest economies, have evolved since 1980 as shown on a series of graphics from Visual Capitalist. When the United States is the larger trading partner, nations that trade the most with the United States are coloured in blue, when China is the larger trading partner, nations that trade the most with China are coloured in red and shades of purple/pink representing years where trade with the United States and China is more-or-less equal. Here is the data in five year increment with the exception of 2001:
1.) 1980:
2.) 1985:
3.) 1990:
4.) 1995:
5.) 2001: this is a key year given that China became a member of the World Trade Organization on December 11, 2001:
6.) 2005:
7.) 2010:
8.) 2015:
9.) 2018:
In 1980, the United States heavily dominated global trade with 80 percent of nations trading more with the United States that they did with China. As you can see, after 2001, China rapidly began to dominate global trade and, by 2018, was dominating trade in nearly all of Africa, Asia, Australia, Europe (particularly Eastern Europe) and South America; by 2018, only 30 percent of nations or 62 out of 190 nations trading more with the United States than with China.
Given the gutting of America's manufacturing sector since the early 2000s as shown here:
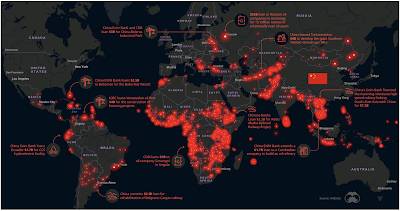
…and China's massive investment in its One Belt, One Road Initiative which could total between $1 trillion and $8 trillion and its financing of some of the world's megaprojects as shown here:
…no matter what Washington does in its quest to "fix" its trade problem with China, it is highly unlikely that the United States will ever regain its place at the pinnacle of world trade.
Click HERE to read more from this author.
You can publish this article on your website as long as you provide a link back to this page.



Be the first to comment