
 Remember the 1995 flick, Waterworld? I have to agree with Rotten Tomatoes, it was lucky to get a 42 percent rating on the old Tomatometer. I’m proposing a remake, but instead of water, the world is drowning in fiat currency debt! Too bad it’s not fictional, isn’t it?
Now that Eurozone and American debt issues are front page news once again, I thought that I’d take a look at a paper published by Eswar Prasad and Mengjie Ding entitled "The Rising Burden of Government Debt" from the Brookings Institute. As background for those who aren’t aware, the Brookings Institution, founded in 1916 by philanthropist Robert S. Brookings is:
"… a nonprofit public policy organization based in Washington, DC. Our mission is to conduct high-quality, independent research and, based on that research, to provide innovative, practical recommendations that advance three broad goals:
• Strengthen American democracy;
• Foster the economic and social welfare, security and opportunity of all Americans and
• Secure a more open, safe, prosperous and cooperative international system."
I don’t know about you but this kind of reminds me of the mission statement for the Department of State. The Brookings Institution states that they are non-partisan.
Mr. Prasad, one of the authors of the paper, is a Senior Fellow at the Brookings Institution and a Senior Professor of Trade Policy at Cornell University. He is a former Chief of Financial Studies Division at the International Monetary Fund’s Research Department.
Back to the "Rising Burden of Government Debt". The authors noted that the Great Recession of 2008 – 2009 triggered a rather massive increase in the levels of sovereign debt in terms of both absolute level and in terms of ratio to GDP. In 2007, the world’s sovereign debt level stood at $23 trillion. This rose to an anticipated $34 trillion in 2010 and is forecast to rise to $48 trillion by 2015. What is most interesting about recent sovereign debt accrual is which nations are the most guilty of adding to their "pile of debt".
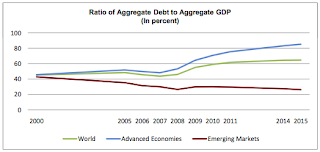
According to the IMF, the world’s overall fiscal deficit reached 6.7 percent of GDP. The ratio of world debt to world GDP rose from 44 percent in 2007 to 59 percent in 2010. IMF projections anticipate that the ratio could rise to 65 percent in 2015; while that seems low by Japanese standards (currently approaching 200 percent), keep in mind that relatively fiscally prudent countries like China and Australia are being lumped in with Japan, the United Kingdom, Ireland, Italy, Greece and their ilk. The IMF has calculated that the average gross general government debt-to-GDP ratio for the world’s advanced economies will rise from 91 percent at the end of 2009 to 110 percent in 2015, an increase of 37 percentage points since the beginning of the Great Recession. Among the G-7 nations, the government debt-to-GDP ratio is on target to rise to levels above record post-World War II levels with the United States and the United Kingdom getting medals for the largest debt increases. Here is a graph showing the projected government gross debt ratios for both advanced economies and for emerging nations from 2000 to 2015:
You will notice in the graph that the debt-to-GDP levels for emerging nations is projected to gradually decline. This projection is based on sustained economic growth and low interest rates resulting in lower bond yields.
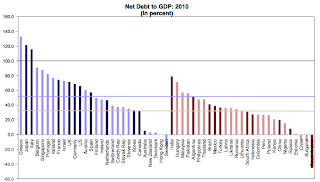
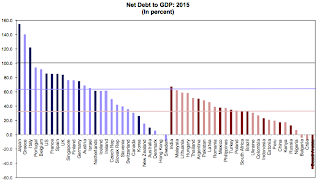
Here are two graphs showing the debt-to-GDP ratios for the nations in the study for 2010 and 2015. Note that the debt-to-GDP ratio for the advanced economies (in purple) rises far faster than those of the developing nations (in rose):
Remember 20 years ago when it was "so 80s and 90s" to watch what we used to insensitively call "third world nations" default on their sovereign debt? Well, it turns out that in today’s world, those same nations are the relatively prudent ones. It is the so-called developed nations that really suck badly at keeping their spending in line with their revenues. It’s kind of like watching what happens to a family fortune as the generations pass. The first generation works really hard, saves money and builds up the business to be a financial success. The second generation, while not quite as savvy as the first generation, still manages to hold the business together. They may take on some debt and make some bad spending decisions but, overall, the business grows modestly and by all appearances it is a success. Things fall apart when the third generation takes over. Debt ramps up massively, inadvisable acquisitions are made and the company becomes the target of both a shareholder revolt and a hostile takeover. I’d say that most "developed" nations have reached the third generation point in their fiscal existence.
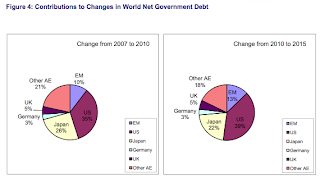
Prasad and Ding state that advanced economies account for the bulk of the increase in sovereign debt since the start of the Great Recession. Here’s a table showing just how true that is:
Interestingly enough, the IMF has just the solution for all of our woes. That’s right, you guessed it – raise taxes. Not just any taxes, mind you, but the ones that hurt us where we spend. Here’s a quote from their Fiscal Monitor dated May 14th, 2010:
"…a package of tax increases that are relatively less distortionary— including elimination of below-standard VAT rates and increases in tobacco and alcohol excises, carbon taxation, and property taxes—that could yield almost 21⁄2 to 3 percentage points of GDP in advanced economies. Introducing a VAT or raising standard VAT rates in some countries could also yield sizable revenues. Finally, tax evasion remains significant in many countries, and fighting it should be a priority."
Notice how they throw in the spectre of the dreaded "tax evader", leading us to believe that tax evasion has a meaningful impact on why sovereign debt levels have risen. Damn you tax evaders, look at what you’ve done to the rest of us! Perhaps that’s why the mainstream media in the United States iswarning American taxpayers that the IRS is waiting on the doorstep to audit taxpayers.
If we look back at the debt crisis of the world’s poorest countries, we can readily see just how different the scale of the problem is for developed nations. In 1970, the world’s poorest countries owed $25 billion in debt. By 2002, this had risen to $523 billion and, of that, $153 billion was owed to the World Bank and the IMF. For Africa alone, the debt in 1970 was just under $11 billion; this had risen to $295 billion by 2002. While $523 billion seemed like a rather large pile of debt back in 2002, it certainly looks like chump change when compared to the United States debt of over $14.3 trillion and Japan’s debt of over $10 trillion, doesn’t it? Here is one more interesting statistic;according to World Centric, Nigeria borrowed $5 billion and has paid back about $16 billion and still owes $28 billion because of bias in creditor nations’ interest rates. That sounds like a loan shark operation to me.
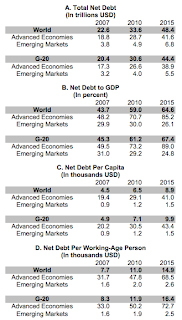
Here’s a fascinating chart from the Financial Times website. It shows the debt levels for what are classified as "advanced nations" (i.e. Eurozone nations, United States, Canada, Japan and the like) and "emerging nations" (i.e. Hungary, Argentina, Brazil, South Africa etcetera). The chart can display net debt per capita (my favourite metric), net debt as a percentage of GDP and one of the best metrics I’ve seen, debt per working-age person. You can get country specific data by clicking on the bars and the data can be filtered for G20, EU and G7 plus the BRIC countries. It also shows projections for the year 2015.
Here is the table showing the total net debt, net debt-to-GDP, net debt per capita and net debt per working age person for the world and divided into advanced economies and emerging economies:
While I realize that the $48.4 trillion world total net debt by 2015 sounds more than a tad daunting, it is miniscule when compared to the United States’ fiscal gap of $202 trillioncalculated by Lawrence Kotlikoff, a professor of Economics at Boston University. He calculates the fiscal gap by adding the official public debt to the underfunded and unfunded Social Security, Medicare and Medicaid benefits…..but that’s a subject for another time.
It is most fascinating to look at the world’s overall sovereign debt situation. One has to wonder how long we can stay afloat in this sea of debt before fiscal mismanagement at all levels of government sinks the world’s economy for good.
Click HERE to read more of Glen Asher’s columns.
Article viewed at: Oye! Times at www.oyetimes.com
You can publish this article on your website as long as you provide a link back to this page.

Be the first to comment