Recently, there have been rumblings in the mainstream media covering market pundits who are falling onto the silver bandwagon. After the Hunt brothers silver debacle of the late 1970s and early 1980s, silver has been the pariah precious metal. Now, at long last, investors are starting to see the light albeit dimly. Gold has always been the sexy, shinier brother that gets all the press coverage while silver has taken a seat way at the back of most investors’ portfolios.
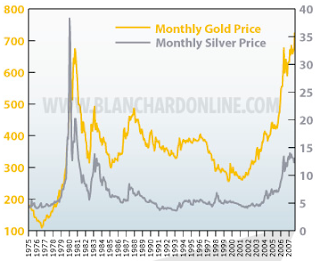
Let’s start with a price chart for silver (in grey) and gold (in yellow) from 1975 to 2007:
Note the spike in 1979/1980 when silver hit $49.45 per ounce, thanks to Herbert and Nelson Hunt’s efforts to corner the market. It was estimated that the Hunts held over 100 million troy ounces of silver and when the bubble burst, the price quickly fell to less than $10 per ounce. This left many small speculators holding nearly worthless silver coins and bars and pretty much soured the investment community on silver until recently.
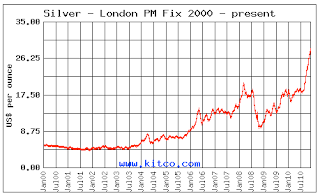
Between 1985 and 2006, the price of silver was trapped between $5 and $10 per ounce. When gold started its long slow climb up to today’s levels, silver started to move up after a slight time lag. Let’s look at a more detailed chart from Kitco showing the trading price of silver over the past 10 years:
Silver started to break out of its multi-year range in early 2006 when it broke through the $10 per ounce ceiling on March 3rd, 2006. It climbed to a peak of $21 per ounce on March 17th, 2008 and then rapidly headed south as the Great Recession took hold, hitting just under $9.00 per ounce on October 24th, 2008.
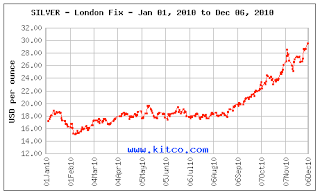
Now, let’s watch the price climb over the past 11 months:
Silver started 2010 at $17.17 per ounce. It moved very little over the next 8 months, trapped between $15 and $19 per ounce until September 8th, 2010 when it finally broke through the $20 per ounce ceiling. Since that time, silver has climbed rather steeply, hitting a high of $30.72 per ounce on December 7th, 2010. That’s a gain of 53.6 percent since the beginning of September alone. Looking back, silver has gained 78.9 percent since the beginning of 2010 and 207.2 percent since it first passed the $10 per ounce ceiling in early 2006. All in all, a pretty sweet return on what can be a very modest overall investment.
Many people wonder how to invest in silver. Since it trades at a low price compared to gold, you can get a lot of bang (weight in ounces) for your spare change. A favoured way of purchasing silver is through your local coin dealer. People are constantly bringing their old silver pocket change to coin dealers thinking that they will strike it rich. Not so. Most coins that were in circulation are far too worn to have any numismatic value so most coin shop owners will simply offer their customers a price for the coin that reflects the value of the silver content should the coin be melted down less a discount which ultimately becomes the dealers profit margin. In the case of Canadian silver change, the content varies by the year as follows:
Pre-1920: 0.925 fine (92.5% silver)
1920 to 1966: 0.800 fine (80% silver)
1967: some coins are 0.800 fine and some are 0.500 fine (50% silver)
1968: some dimes and quarters are 0.500 fine, fifty cent pieces and dollars are nickel
You can calculate the amount of silver in an 80 percent silver coin by multiplying the face value of the coins by 0.60. For example, $10 in quarters would be 6 ounces of pure silver.
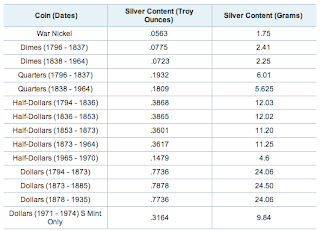
In the United States, the Coinage Act of 1965 put a halt to the mintage of silver coins and replaced them with nickel coinage. Here is a table showing the silver content of American coins in Troy ounces per coin:
Nickels contained 35% silver between 1942 and 1945, dimes contained 89.24% or 90% silver until 1964, quarters contained 89.24% or 90% silver until 1964, half dollars contained 89.24% or 90% silver until 1964 and dropped to 40% silver between 1965 and 1970 and dollar coins contained 89.24% or 90% silver until 1964 (the 1964 dollars are extremely rare since they were melted down after they were struck – it is actually illegal to own one) and the 1971 to 1974 and 1976 dollars contain 40% silver.
Here is a link that has an American silver coin value calculator where you can plug in the number of coins you have and the latest price of silver to calculate the approximate value of your junk coins. I can’t speak for its accuracy.
The United Kingdom reduced the silver content in its coins very early on. In 1920, the silver content of all British coins was reduced from 92.5% to 50%. Again, in 1947 the silver content was reduced to zero except for Maundy coins, small silver coins distributed on Maundy Thursday by the British Monarch. These coins are not widely circulated and are far more valuable to collectors than their silver content (92.5% up to 1921 when it was reduced to 50% and then raised back to 92.5% in 1947).
When purchasing junk silver, keep in mind that dealers will often charge a bit of a premium for higher denomination coins like half and full dollars although, as the price of silver has risen, that practice seems to be disappearing. There is rarely a shortage of junk silver, however, during times of anticipated crisis (i.e. Y2K), many coin dealers were completely sold out. Right now, there seems to be more people selling their coins than people buying so supply should not be a problem.
…and, you know what the best part of buying silver is? No one can accuse you of being a crazy "gold bug"!
Click HERE to view more.
You can publish this article on your website as long as you provide a link back to this page.


Be the first to comment