Recently, Fiserv released its analysis of the United States housing market. Here are a few of the salient points from their summary accompanied by my usual commentary.
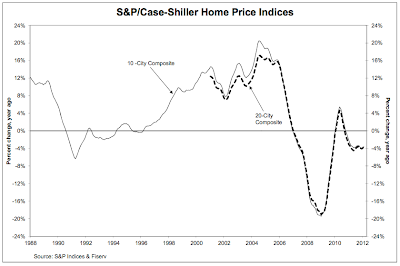
Let's open by looking at the most recent Case-Shiller chart of national home price indices showing that things are not exactly looking up:
Fiserve notes that the U.S. housing market is finally showing some signs of stabilizing. Home prices in 70 markets or 18 percent of the 384 metropolitan areas tracked by Fiserv Case-Shiller showed an increase or were unchanged between December of 2010 and December of 2011. That noted, price declines of two percent or less were noted in 32 percent of the market with the remainder of the metropolitan areas, nearly half of the total (191 metropolitan areas), showing price declines of more than two percent.
Price appreciation was noted in Detroit, and Michigan (up 9.8 percent) and Cape Coral, Florida (up 3.5 percent), however, this has to be taken into context since these areas have seen peak to trough price declines well in excess of 50 percent. In sharp contrast, double digit price decreases were noted in Atlanta, Georgia (down 12.8 percent), Reno, Nevada (down 10.8 percent) and Tucson, Arizona (down 10 percent), all on a year-over-year basis.
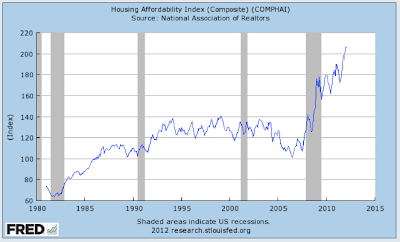
Fiserve expects that housing prices will hit bottom later this year with the nation's market ending up with prices that are, on average, 35 percent below their first quarter 2006 peak. This massive price drop has resulted in the ratio of the price of a median single family home to median family income at its lowest point since 1991. In fact, for those lucky Americans that are not underemployed or unemployed, the mortgage payment for a median-priced home now consumes only 12 percent of a median family's income, the lowest percentage since record-keeping began in 1971. From FRED, here is a graph showing housing affordability back to 1980:
So we can all better understand this graph, here's how FRED measures housing affordability:
"Value of 100 means that a family with the median income has exactly enough income to qualify for a mortgage on a median-priced home. An index above 100 signifies that family earning the median income has more than enough income to qualify for a mortgage loan on a median-priced home, assuming a 20 percent down payment. For example, a composite housing affordability index (COMPHAI) of 120.0 means a family earning the median family income has 120% of the income necessary to qualify for a conventional loan covering 80 percent of a median-priced existing single-family home. An increase in the COMPHAI then shows that this family is more able to afford the median priced home."
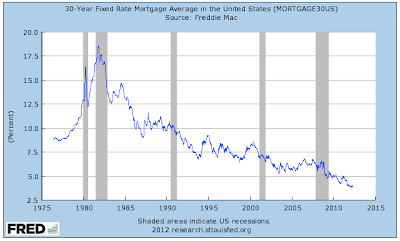
Fiserve is correct, housing affordability is at generational highs. While this is due, in part, to the drop in prices, it is also due in large part to the generational lows in 30 year fixed rate mortgage interest rates as shown here:
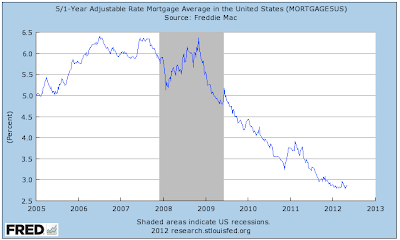
For completeness sake, here is a look at how low interest rates are on 5 year adjustable rate mortgages when compared to just 7 short years ago:
Fiserv also notes that housing prices are now back to their 1998 levels when compared to rents.
Fiserv projects the following:
1.) Some of the hardest-hit markets will experience the fastest growth during the recovery with six of the ten markets that had price declines of 50 percent or more from their peaks, will rise the most over the next five years.
2.) Home prices in markets that declined the least over the past 7 years will grow at a slower pace than the average. For example, Texas accounts for 11 of the 39 markets that will experience very modest annualized price increases of 1.5 percent or less over the next five years.
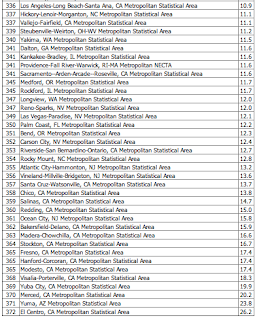
3.) Of the 30 best-performing housing markets in the fourth quarter of 2011, 13 had unemployment rates of less than 7 percent. For interest's sake, here is a screen capture showing the metropolitan areas in the United States that had unemployment in excess of 9.5 percent in March 2012:
With 83 or 22 percent of the 382 major metropolitan areas in the Bureau of Labor Statistics' survey areas having a U-3 unemployment rate in excess of 9.5 percent, it will be a while before a good employment picture has much of an impact on real estate prices.
In conclusion, the Chief Economist at Fiserv, David Stiff, projects that:
"…the housing sector hit bottom last year and has started along a path of slow recovery. The recovery this spring and summer will be driven by investors, who buy primarily in lower-cost markets. In the current environment, focusing on mortgage applications is not a true indicator of sales activity, as investors are less likely to finance home purchases via mortgages. We expect that home prices, which generally lag changes in sales activity by nine to 12 months, will stabilize by the end of this summer and then rise at an annualized rate of 3.9 percent over the next five years." (my bold)
It will certainly be interesting to see what happens to prices (and affordability) when interest rates return to their normal range. I suspect that Fiserv's analysis of the end of the decline in housing prices may well be found wanting.
Click HERE to read more of Glen Asher's columns
You can publish this article on your website as long as you provide a link back to this page.


Be the first to comment