There is one rather little reported economic statistic that goes a long way to explaining why this recovery has been so poor; the velocity of money. This measure is actually an excellent indicator of economic activity, however, since this statistic is not widely used outside the world of economists, perhaps a bit of an explanation is in order.
Let's start by defining M2. M2 is the supply of currency in circulation plus both demand and chequing deposits (the aforementioned being M1 or the narrowest definition of the supply of money) plus savings deposits, certificates of deposit (less than $100,000) and money market deposits.
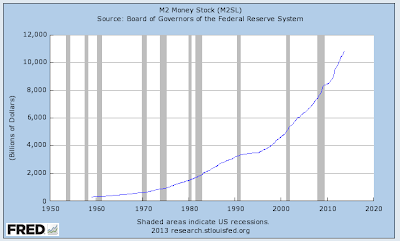
Now, let's look at the growth of M2:
Since the beginning of the Great Recession in December 2007, the M2 money supply has grown from $7450.8 billion to its current level of $10818.5 billion, an increase of 45.2 percent. There must have been a lot of late nights at the Federal Reserve, "printing" all of that money!
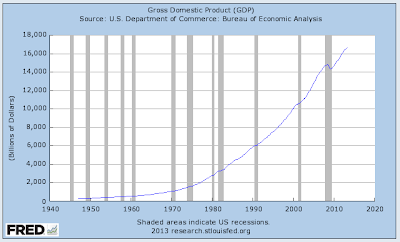
Now, let's look at the growth in nominal GDP:
Since the beginning of the Great Recession in December 2007, nominal GDP has grown from $14672.9 billion to its current level of $16661 billion, an increase of only 13.5 percent. Note that the growth in M2 has far outstripped the growth in nominal GDP.
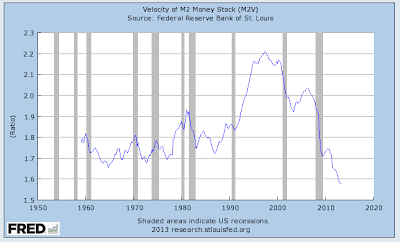
As a result, here's a graph that explains a lot about why the American economy is lagging:
The velocity of money has dropped substantially since the beginning of the Great Recession and continues to fall. In fact, at this point in time, the velocity of money is at its lowest level in over five decades.
What exactly is the velocity of money and how does it help us to understand what is happening to the economy? The velocity of money is calculated as the ratio of nominal GDP to the average of the M2 money supply, in other words, the second graph (GDP) divided by the first graph (M2). It describes the frequency that one unit of currency is used to purchase goods and services or the number of times one dollar is spent to buy goods and services in a given period of time. If the velocity of money is increasing, more buying and selling is taking place, conversely, if the velocity of money is decreasing, as is the current situation, then less buying and selling is taking place.
Central banks hope that by boosting the supply of money, that consumption will rise, boosting GDP. In our current situation, the Federal Reserve has obviously boosted the supply of money through one of the means available to it (lower interest rates, changing bank reserve requirements and through the open market by purchasing government bonds), however, this huge boost of money has not been used as often (or at all) like the Fed has hoped.
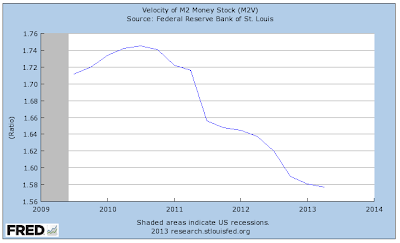
As you can see from the third graph, during each recession over the past five decades, the velocity of money has dropped but, as the economy ramps up, the velocity rises generally as a result of an increase in the supply of money. This is most noticeable after the 1990 -1991 recession. During the Great Recession, the velocity of money dropped by the largest amount in the past eight recessions. During the first half of 2010, the velocity rose very slightly, however, since the third quarter of 2010, it has fallen and is showing no sign of reversing that trend as shown here:
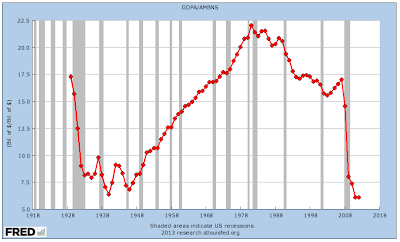
Let's go back even further in time and look at another velocity of money chart using GDP and the annual St. Louis Adjusted Monetary Base (explained here) instead of M2:
Notice that the drop in the velocity of money after the Great Recession is unprecedented….except, if you go all the way back to the Great Depression. That's rather sobering, isn't it?
It's quite obvious to most of us that something is very different about this so-called recovery. While there are a host of reasons that can be used to explain why the post-Great Recession recovery has been so tepid, all of the factors combined have contributed to a dropping and very low velocity of money which is most unusual at this point in a growth cycle. It is also quite obvious that the Fed's ZIRP experiment has been a dramatic failure as consumers are simply unwilling to spend no matter how much central bankers prod them to do so. On the upside, the slow velocity of all of those dollars that have been printed by Mr. Bernanke et al means that inflation has been kept low. For that, we should all be thankful, at least for now. God help us all when all of those dollars are in a hurry to go somewhere and the velocity of money begins its march upwards!
Click HERE to read more of Glen Asher's columns
You can publish this article on your website as long as you provide a link back to this page.

Be the first to comment