
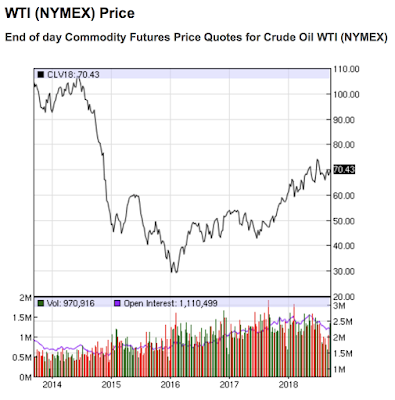
With oil prices approaching levels not seen since 2015 as shown here:
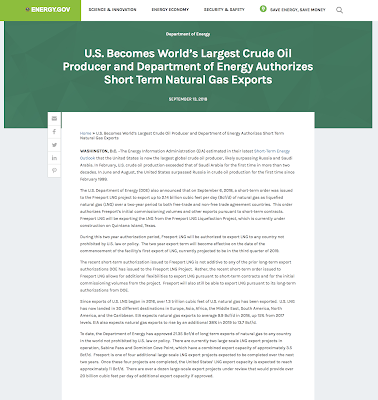
…there is growing concern from Washington that American consumers could see a significant increase in prices paid at the pump. This is rather surprising given Washington’s repeated mantra that the United States is now “energy independent” and leading the world’s oil producing nations as shown in this recent press release from the Department of Energy:
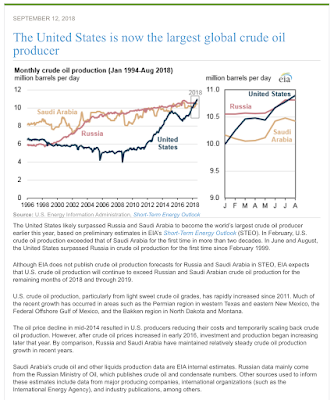
Here is the U.S. Energy Information’s (EIA) short-term energy outlook referred to in the press release:
Let’s take a closer look oil production statistics for the United States followed by an analysis of why Washington seems convinced that America has reached a new reality of oil independence and why I believe that this is merely a temporary illusion
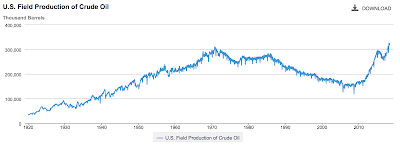
Here is a graph from the EIA showing the annual production of crude oil in the United States going back to 1920:
As a geoscientist, the first thing that I noticed about this graph was the plateau in production starting in the early 1970s when domestic production peaked at 310 million barrels in 1970 followed by declining production starting in 1985 with production falling to a low of 119 million barrels in September 2008. At that point, production started to very rapidly ramp up to its current all-time high of 324.3 million annually in March 2018. This increase in production is solely due to one factor that I will discuss later in this posting.
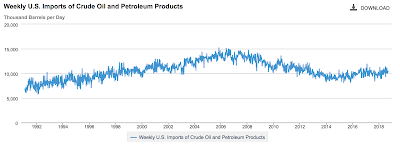
Here is a graph which shows United States imports of crude oil and petroleum products going back to 1991:
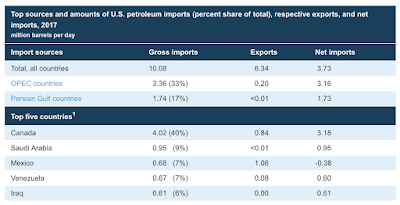
As you can see, imports of crude oil peaked at just over 15.2 million BOPD in November 2005 and gradually dropped starting in late 2008, in part, because of the Great Recession’s economic contraction and the early phases of increased domestic oil production. The last data point for September 2018 shows that the United States imported 10.519 million BOPD from the following sources:
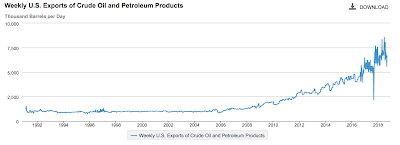
Here is a graph which shows United States exports of crude oil and petroleum products going back to 1991:
Crude oil exports from the United States have steadily increased from less than 1 million BOPD in 2005 (and prior years) to a high of 8.332 million BOPD in April 2018. In the last month for which data is available, the United States exported 6.688 million BOPD of crude oil and associated products. Here is list of the top five destination countries for American oil:
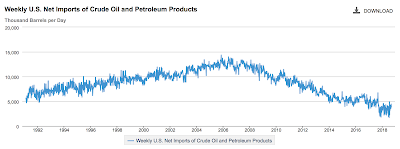
From this data, we can see that, even with both domestic oil production and oil exports at or near record levels, the United States is still a net importer of oil as shown on this graph:
Net oil imports reached a high of 14.37 million BOPD in November 2004 and, with the advent of increased domestic oil production in 2008, have steadily fallen to their current range of 2.6 to 4.5 million BOPD in 2018.
So, while Washington is touting newfound American oil independence, as you can see, the United States is not entirely oil self-sufficient.
As I promised, I would explain the reasons why American domestic oil production has seen a historically unprecedented rise since 2008 I why this is of concern. There are two inter-related causes:
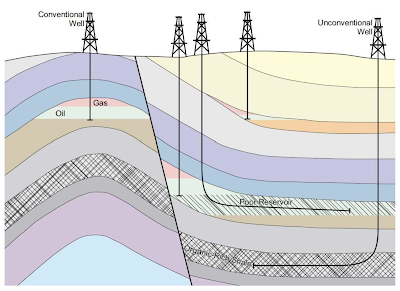
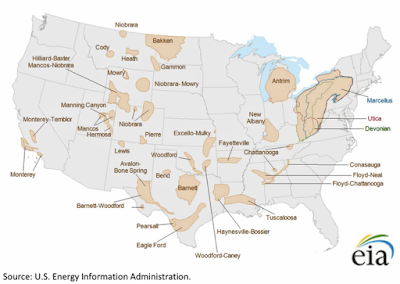
1.) unconventional oil – reservoirs that have low permeability and porosity which require horizontal drilling and multi-stage hydraulic fracturing to achieve economic production levels. In the United States, these play types are found in the following areas (and others as well):
a.) Bakken of North Dakota and Montana
b.) Eagle Ford of South Texas
c.) Marcellus Shale of Pennsylvania
d.) Permian Basin of West Texas
e.) Niobrara of South Dakota, Colorado, Nebraska and Wyoming
Here is a diagram showing the differences between conventional and unconventional reservoirs:
Here is map from the EIA showing the full extent of unconventional oil and natural gas plays in the United States:
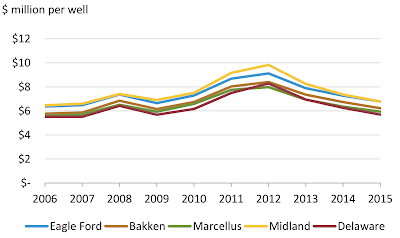
2.) Interest rates: Let’s look at some background first. The costs associated with drilling and completing unconventional wells is, on average, several times the cost of drilling and completing a conventional well. As shown on this graph from the EIA, while costs for unconventional wells have dropped somewhat, they are still extremely high:
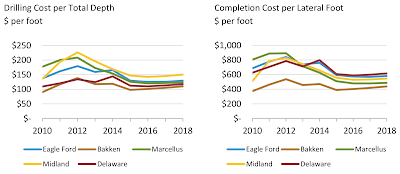
Here is a graph comparing the drilling cost per foot and the completion cost per foot showing how high completion costs are responsible for the high cost of unconventional wells:
This is why, in large part, the oil industry has had to issue unprecedented amounts of debt to fund their unconventional reservoir programs. Thanks to the Federal Reserve and its lengthy program of near-zero interest rates, the oil industry has been able to borrow money at rock bottom prices. Had interest rates been at historically normal levels, it is certain that some unconventional plays would have been only marginally economical and that American domestic oil production would be far lower than it is today.
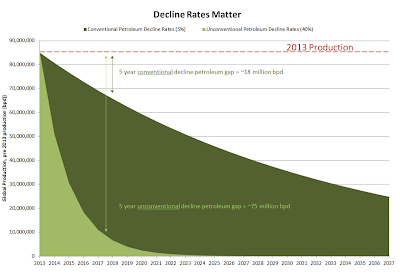
There is one very significant caveat to unconventional oil plays. One of the future problems facing America’s current oil production windfall is declining production. While production from conventional oil wells declines at an average rate of 4.5 percent to 6.7 percent annually (after the production plateau ends), unconventional wells decline far more quickly with annual decline rates of 40 percent per year or more. The higher than traditional decline rates result in a very significant production gap as shown here in dark green:
With extremely high decline rates, oil companies pursuing unconventional hydrocarbon resources are on a “drilling treadmill”, requiring them to continuously spend significant capital if they hope to increase or just stabilize their production levels, something that investors expect. Again, this can only be done when the cost of capital debt is reasonably low, as it is in the current low interest rate environment and, with many of the “sweet spots” already exploited, the oil industry is relegated to the areas with high costs and lower overall productivity. If you are interested in a great summary of the impending problem, please click here.
As you can see, all of the talk about America’s newfound oil riches hinges on the ability of the oil industry to continuously increase production from the nation’s unconventional reservoirs and the Federal Reserve’s ability to maintain its low interest rate policy. Without this and with the United States already importing between 3 million and 4 million BOPD, the illusion of America’s oil independence will be fleeting. At some point, it is clear that American consumers will have to brace themselves for permanently higher oil prices and a much less comfortable future.
Click HERE to view more.
You can publish this article on your website as long as you provide a link back to this page.


Be the first to comment