A report by the Employee Benefit Research Institute (EBRI) provides us with a view of household finances in the United States, focussing on households in the bottom 40 percent of all U.S. households with incomes under $35,600 annually. These households are termed low- to moderate-income or LMI households. This study used 2010 data gleaned from the Federal Reserve Board's latest Survey of Consumer Finances.
1.) LMI Household Debt Levels:
Most LMI households are not overly indebted; in general, households with debt payments that are greater than 40 percent of household income are considered to have unsustainable debt levels. In the study, only 13 percent of LMI households had debt in excess of the comfort zone, the same level as was noted in 2007. As well, only 11 percent of these households had debt that was more than 60 days overdue, slightly higher than the 8 percent level in 2007. How is it possible that these modest income households have such low problem debt levels? Largely because only 60 percent of LMI households had ANY consumer or mortgage debt. Only 22 percent had mortgage debt secured by the equity in their homes, only 28 percent had outstanding credit card balances and only 38 percent had installment loans. These numbers were at 22 percent, 33 percent and 35 percent in 2007.
2.) Household Savings Levels:
Most professionals advise that households have savings equivalent to at least three months of household income as a buffer for emergency situations. In the case of LMI households, a typical household thought that it was prudent to have "precautionary savings" of $3000, however, a median household in the study had savings of only $2700 including retirement savings. Only 37 percent of LMI households had savings of any kind at a bank or credit union. The median amount in these accounts was $700 for low-income households and $1000 for moderate-income households. Other than chequing accounts, very few households had savings in the form of certificates of deposit (9 percent), United States Savings Bonds (5 percent) and stocks outside of a retirement plan (5 percent).
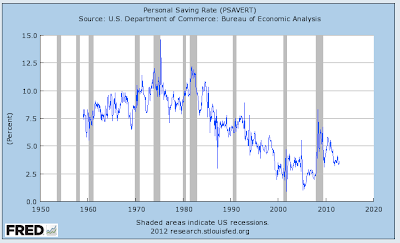
For your information, here is a look at the dropping overall personal savings rate for Americans of all income levels showing how LMI households are saving far less than the average:
The personal savings rate is calculated as the ratio of personal savings to disposable personal income. Since 1959, America's personal savings rate has ranged from a high of 14.6 percent in May 1975 to a low of 0.9 percent in October 2001. At the beginning of the Great Recession, the personal savings rate rose from 2.6 percent in December 2007 to a peak of 6.5 percent in November and December 2008 and has since fallen to its current level of 3.6 percent.
Fortunately for America's LMI households, their debt loads are unlikely to cause them grief when the next economic slowdown hits. Unfortunately, as the cost of most goods and services continue to rise and wage increases remain modest at best, it will be difficult for them to get ahead of the curve.
Click HERE to read more of Glen Asher's columns
You can publish this article on your website as long as you provide a link back to this page.


Be the first to comment