While some aspects of the United States housing market are returning to "normal", at least according to the mainstream media, as you will see, certain key aspects are nowhere near what would be expected this far into the post-recessional "recovery", particularly when one puts the current data into a long-term historical perspective.
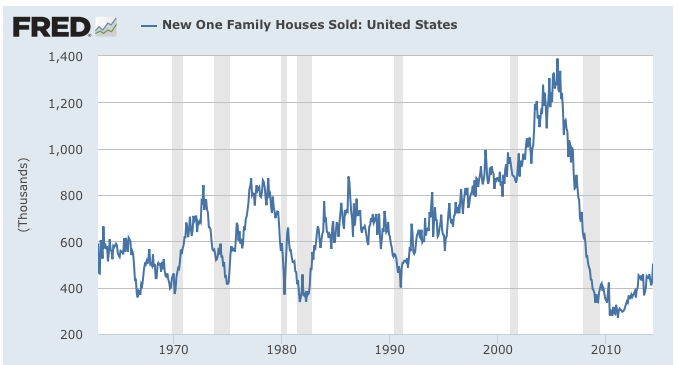
Here is a graph showing the number of new single family homes sold in the United States by month, seasonally adjusted to an annual rate, since 1963 when baby boomers were still wearing short pants:
The current rate of 504,000 is around the level last seen in October 1991 when the population of the United States was 64.1 million people smaller than it is now. You'll also notice on the graph that after the recessions of 1970, 1974, 1981, 1991 and 2001, the new single family home market recovered to its pre-recession level within a matter of a few months at most. While we can argue that the housing bubble and its subsequent bursting are responsible for the lengthy period of depressed new home sales since the end of the Great Recession, it is interesting to see that at the beginning of the Great Recession in December 2007, annualized new home sales were at the 619,000 level, 115,000 or 22.8 percent higher than now.
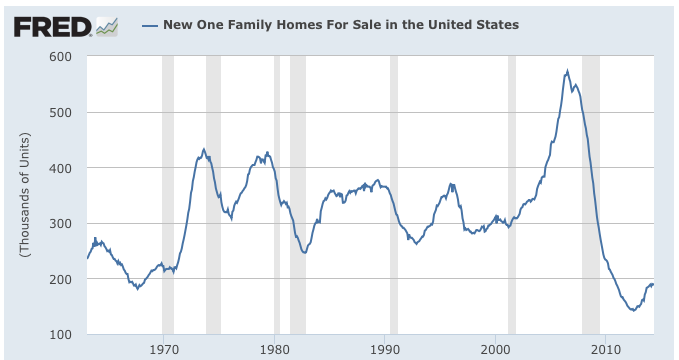
As you can see on this graph, the number of new single family homes for sale in the United States is at almost the lowest level since before Neil Armstrong took his first steps on the surface of the moon:
The current level of 189,000 units is very slightly above the 181,000 level in August 1967, back when the population of the United States was 37 percent lower than today. Prior to the Great Recession, the U.S. housing market was positively flooded with new single family homes for sale; at the peak in July 2006, there were 572,000 new single family homes with for sale signs in the front yard, three times the level seen in mid-2014. One would think that this would make for a sellers market, however, demand for housing just isn't what it was during the pre-Great Recession period. The buildup of the housing bubble created a situation that resulted a real estate market that has a glut of single family homes as buyers lined up to buy more than one home, speculating on a market that seemed to be forever on an upward ride.
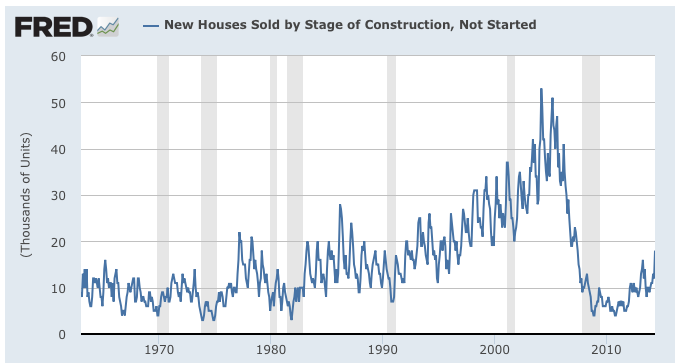
It's also interesting to look at this little reported statistic:
In mid-2014, there were only 18,000 homes in the United States that had been sold but not under construction. This is down from a peak of 53,000 in March 2004 but up from a low point of only 4,000 in December 2008. We have to go all the way back to early 1997 to see such a low level of pre-sold, unbuilt housing.
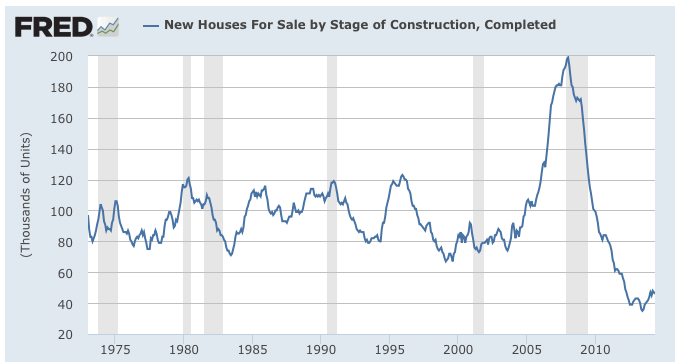
Lastly, here is a graph showing the number of new houses that have been completed and are for sale (also known as spec built homes):
Obviously, home builders are limiting their exposure to risk by reducing the number of spec built homes. In May 2014, there were only 46,000 completed new homes that were for sale. This is less than one-quarter of the 199,000 completed homes that were for sale in January 2008 and is well below levels seen going all the way back to 1973 when there were between 80,000 and 104,000 completed units for sale and the population of the United States was only 212 million, one-third smaller than it is today.
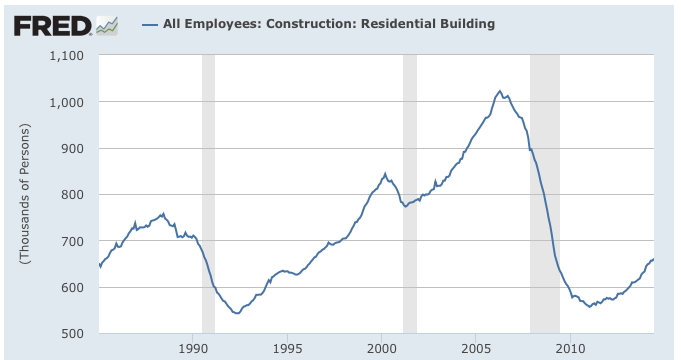
All of the realignment in the housing industry has led to this:
At its peak in April 2006, there were 1.022 million residential construction workers in the United States. This is now down to 660,600, a drop of 361,400 or 35.4 percent. We have to go all the way back to May 1996 to find the same level of residential construction employment.
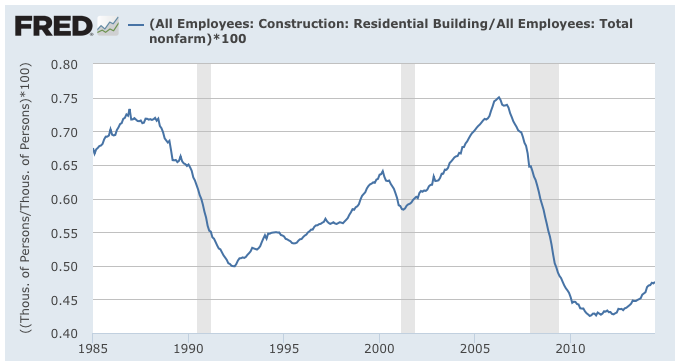
Lastly, here is a graph showing the percentage of all U.S. non-farm workers that are employed in residential construction:
In May 2014, 0.47 percent of all American workers were employed in residential construction. This is the lowest level since 1995 and is barely above the post-Great Recession low point of 0.425 percent.
When we read or hear about the improvements U.S. housing market from the mainstream media, particularly when current data is being compared to the data from the depths of the Great Recession, we need to look at the data over the long-term. When we see that the housing market is now at levels last seen in the 1970s, 1980s and 1990s when the population of the United States was far lower than it is now, we get an accurate perspective of the ongoing housing market crisis, particularly when we keep in mind the historically unprecedented monetary policy actions of the Federal Reserve.
Click HERE to read more of Glen Asher's columns
You can publish this article on your website as long as you provide a link back to this page.

Be the first to comment