The United States job report of December 3rd looks rather grim. Unemployment rose to the 9.8 percent level after spending three months at 9.6 percent with the very, very modest addition of 39,000 nonfarm payroll jobs, likely just a statistical blip. The total number of persons unemployed rose to an astounding 15.1 million with 10 percent of adult men unemployed and 8.4 percent of women unemployed. The jobless rate for Hispanics hit 13.2 percent and the jobless rate for black workers hit a stratospheric 16 percent.
The number of long-term unemployed (27 weeks and longer) was little changed at 6.3 million and accounted for 41.9 percent of the total unemployed. In addition, 9 million workers were employed part-time for economic reasons (i.e. they’d prefer to work full-time but economic conditions are not permitting them to find full-time work or their working hours had been reduced).
The number of marginally attached workers reached 2.5 million, up from 2.3 million. These are workers that are not in the labour force, they want and are available for work and had looked for work sometime in the past 12 months. Statisticians for the Bureau of Labor Statistics (BLS) do not count these workers among the unemployed because they had not looked for work during the four weeks preceding the survey. Among those, there were 1.3 million workers that are classified as discouraged; these poor folks are not currently looking for work because they do not believe that work is available. This number is up markedly from 421,000 a year earlier.
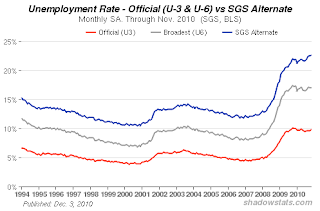
From the Shadow Government Statistics website, here is the chart showing the U3, U6 and SGS unemployment statistics for the latest month:
Notice that the broadest measure of unemployment, the SGS Alternative which adds long-term discouraged workers and BLS U-6 short-term discouraged workers to the U-3 BLS reported unemployment statistic. We can readily see that the SGS Alternative rate is still climbing and is nearly 23 percent. That’s 1930’s-style soup kitchen territory.
This week, we saw moderate mainstream media coverage of the funds loaned by the Federal Reserve to Mr. Bernanke’s cronies on Wall Street. At least $3.3 trillion was loaned to banks around the world in a last ditch attempt to keep the world economy afloat, to keep the stock market from tanking and to preserve jobs. As well, in November, Mr. Bernanke announced the Fed’s Quantitative Easing 2 program where the American central bank will purchase up to $600 billion worth of Treasuries through to June 2011 in yet another desperate attempt to keep interest rates low, pour money into the economy and keep it humming on at least a few of its eight cylinders.
The only country that has had an extensive experiment with quantitative easing is Japan as noted in this posting. Since 2001, the Bank of Japan has pushed its overnight rate down to nearly zero percent where it has pretty much stayed. Over a four year period, the BOJ also increased the commercial bank current account balance from 5 trillion yen to 35 trillion yen and tripled its purchase of long-term Japanese government bonds in an attempt to hold down long-term interest rates and flatten the yield curve. Again in October 2010, the BOJ announced an easing of its interest rates from 0.1 percent to between zero and 0.1 percent and told the market that it intended to increase its quantitative easing program by examining the purchase of $60 billion in additional assets.
Let’s see how well the Japanese nearly decade-long experiment with QE has worked for the Japanese worker by looking at the rise in unemployment since 1980:
Unemployment in Japan hovered around 2 percent in 1980 and didn’t start to rise significantly until early 1998 when it started to rise. It peaked at 5.5 percent in early to mid- 2002, about a year after the BOJ announced its QE program.
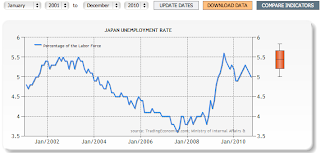
Now let’s look at the trend in Japan’s unemployment data since the BOJ announced its QE program:
As I noted before, Japan’s unemployment rate peaked at 5.5 percent in early to mid- 2002, one year after the QE program was announced. Allowing for some lag time for QE to take effect, we see that unemployment dropped rather rapidly to 3.6 percent in late 2007 but the rate didn’t stay that low for very long and was still above its historical range of 2 to 3 percent. The rate rose markedly as the Great Recession kicked in during the last half of 2008 and first half of 2009 to reach a peak of 5.6 percent, worse than what was seen before the BOJ’s QE program implementation. While these unemployment numbers appear low to those outside of Japan, unemployment numbers of this magnitude are considered extremely high and unacceptable by Japanese society. In fact, having visited Japan last year, I was shocked at the number of people squatting in tent villages under highway bypasses right in the middle of Shinjuku, one of the business hubs of Tokyo.
These statistics tell us that, while quantitative easing may have had some impact on the unemployment rate in Japan, the effects are not lasting and external economic pressures (i.e. a major world recession) can undo all of the positive effects very rapidly and unemployment can rise to very high pre-quantitative easing levels very rapidly. It makes one wonder whether the risks involved in flooding the economy with paper money are worth it.
I hope this is not a lesson lost on Mr. Bernanke and the Federal Reserve
Click HERE to view more.
You can publish this article on your website as long as you provide a link back to this page.


Be the first to comment